Double Top on the Daily Chart
Doji pattern
 |
| Daily Double Top |
 |
| 1-hour Moving Average |
 |
| Flag pattern |
The Euro formed a Double Top chart Pattern whereby the second top is a doji on the daily chart. The EUR/USD initially moved down and reached the price target of the Double Top Chart pattern on thursday (EUR/USD Market Recap 21.06.12), which is the breach of the low between the two tops at 1.2557 (low of June 18th-blue line). The Euro found temporary support at the daily 20 SMA after market breached the blue line. The Euro is currently close to the 61.80 % fib retracement (1.2464) of the recent upswing (daily chart).
Flag pattern
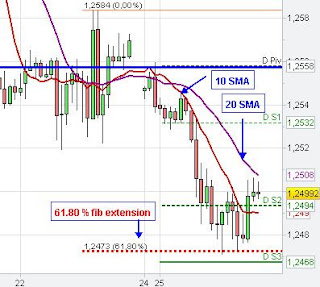
On the 4-hour chart (left) we see that a kind of bearish flag chart pattern was formed. Today market triggered the bear flag and the Euro resumed its downtrend. The 10 SMA (red line) on the 4-hour and 1-hour chart pushed the Euro down. The Euro found some support at the 61.80 % fib extension from the recent swing down (A-B at C-see 4 hour chart).
 |
| 5 min Flag pattern |
The blue circles show some bear and bull flag chart patterns on the 5 min chart. The fib extension levels 61.80 % (initial target), usually 100 % and sometimes even 161 % (strong trend) are typical swing projection targets e.g. of the bull and bear flags. The swing down after the first bear flag moved to the 161 % fib extension (breach of Friday's low-stop triggering). The swing down after the second bear flag only moved to the initial 61.80 % target and the swing up after the small bull flag reached the 100 % fib extension. The recent upswing on the 5 min chart found resistance at the 200 SMA and the 100 % fib extension.
The main question will be whether the Euro can make some larger retracements from the recent 61.80 fib extension on the 4-hour chart or whether the Euro is forming a new bear flag on the hourly/4-hour chart before resuming the down trend to the 100 % fib extension. The hourly 20 SMA and the 200 SMA on the 5 min chart currently provide some resistance.
No comments:
Post a Comment