Trendline Analysis
When does a trendline break?
 |
| Daily Forex Chart Analysis |
 |
| 4 hour Trendline break Timing |
Daily Chart patterns
On the daily chart (above) we see that yesterday's daily candle formed a doji and market formed a kind of double Top. The Euro dropped in today's European and US session and currently market penetrates the daily trendline and the Euro is close to the 20 SMA (purple line).
Breakout Timing
On the 4-hour chart (left) we see that the Euro touched (respected) the daily trendline (red) with the closing of the 4-hour candle at 4 p.m.. The Euro initially dropped further with the beginning of the new 4-hour candle starting at 4 p.m. (Timing) and the Euro penetrated the low of the 18th of June (green line). |
| hourly Support Resistance |
On the hourly chart (left) we see that the Euro found resistance at the 61.80 % fib retracement (1) yesterday in the US session.
Today, the Euro found support at the monthly pivot point in the Asian session (2) and moved up to the 20 SMA (3) where the Euro bounced back. The Euro moved down and penetrated the monthly Pivot point at 8 a.m. whereby the breach of the recent low (grey line, (4)) did not get confirmed on the 5 min chart (stop fishing).
From there, market moved up and finally penetrated the daily pivot point at 1.2691 (5), however, the Euro did not confirm the breach on the 5 min chart (no higher close of the succeeding candles above the range of the breakout candle at 12:20 p.m.) and market formed a strong one-hour rejection candle (long tail of the 12 a.m. candle).
In the following, the Euro dropped down strongly. The 2 p.m. hourly candle respected (touched) the support level at 1.2624 (pink line-January low, orange circle) and market initially breached this level with the beginning of the 3 p.m. hourly candle.
The same pattern occurred at the hourly 200 SMA and the daily trend line (red line). Market touched this support level and immediately after the close of the hourly and 4-hour candle at 4 p.m. (Timing) the Euro breached this support level and resumed its downward trend (black circle).
 |
| 5 min Support Resistance |
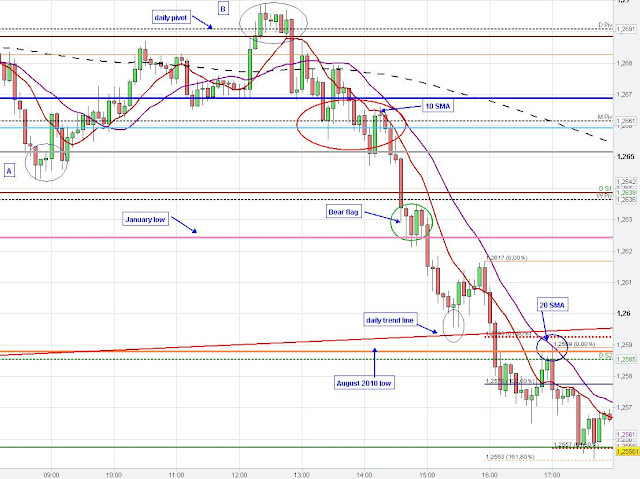
The 5 min chart (above) shows the failed breakout confirmation at the grey line (A) and the daily pivot point (B). The red circle illustrates typical price behaviour around support and resistance. The 1:35 p.m. candle breached the monthly pivot but could not close below, however, the second breach got confirmed on the 5 min chart from the 2:05 p.m. candle.
The Euro moved up again but market could not regain the prior support level (no confirmed close above the monthly pivot). The Euro also found resistance at the decreasing 10 SMA (red line), and the 5 min candle at 2:15 p.m. closed as a doji. The monthly pivot point now acted as resistance and price moved down. The green circle shows the bearish consolidation (bear flag) at the pink line (January low).
The Euro breached this level at 3 p.m. initially after the hourly candle closed at this support level. The same price behaviour occurred at 4 p.m.. In a strong bearish or bullish environment market often close at key levels and after market respected these levels with the candle close these levels often get breached with the beginning of the new candle (either for a false or confirmed breakout-Timing). This price behaviour is visible on all time frames. The blue circle on the 5 min chart shows the retest of the orange line (low of August 2010) after this level got breached (confirmed). The 20 SMA also pushed the price further down (trend continuation).
No comments:
Post a Comment