Weekly and Daily Analysis
Inverted Head and Shoulders
 |
| Weekly Chart Analysis |
 |
| Daily Chart Analysis |
On the weekly chart we observe that the Euro moved up to the January 2012 low (orange line).
On the daily chart we see that EUR/USD respected (closed at) the 20 SMA yesterday and today price moved above the 20 SMA up to the January's low at 1.2624 (orange line) and the 61.80 % fib retracement at 1.2620. This resistance zone held the Euro and price fell back from this level into the price range of yesterday's daily candle. EUR/USD already failed to recapture the low from January 2012 on May 28th (recent high from May 28th coincides with January's low).
 |
| 1 hour EUR/USD forex chart analysis |
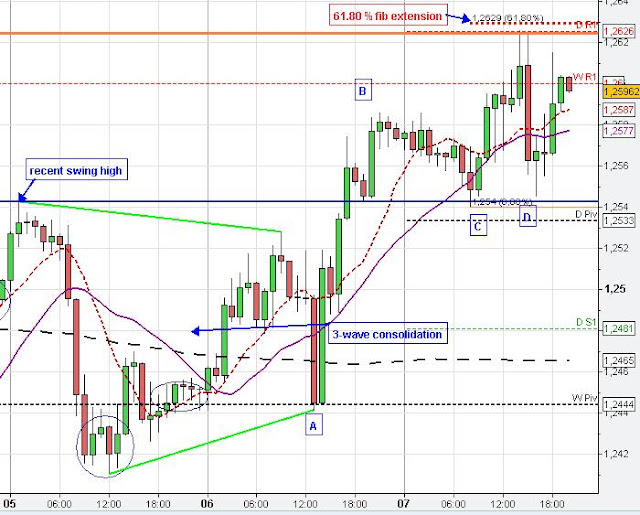
On the hourly chart (above) we see that the Euro started today's up move from the recent swing high at 1.2543 (blue line-C). After the back test of this level (resistance became support-C) EUR/USD moved above the weekly R1 but market found resistance at the orange line (low from January 2012), 61.80 fib retracement, daily R1 and the 61.80 % fib extension (A-B at C)
Overall, the Euro could not overcome this resistance zone at about 1.2624 and in the following price sharply fell back from resistance at 4 p.m. before price found solid support at at the 10 SMA on the 4 hour chart at 1.2546 (4 p.m. candle-not shown) closely to the recent swing high (blue line-support-D) at 1.2543.
 |
| 5 min Inverted head and shoulder |
On the 5 min chart we see that EUR/USD formed a typical 3 wave consolidation pattern at the price level of the weekly R1 (between 1-2 p.m.) before the Euro resumed it's uptrend terminating at the resistance zone. The Euro reversed sharply and took out the recent striking low at 1.2562.
No comments:
Post a Comment