Important Candlestick Reversal Patterns
How to trade Candlestick Pattens
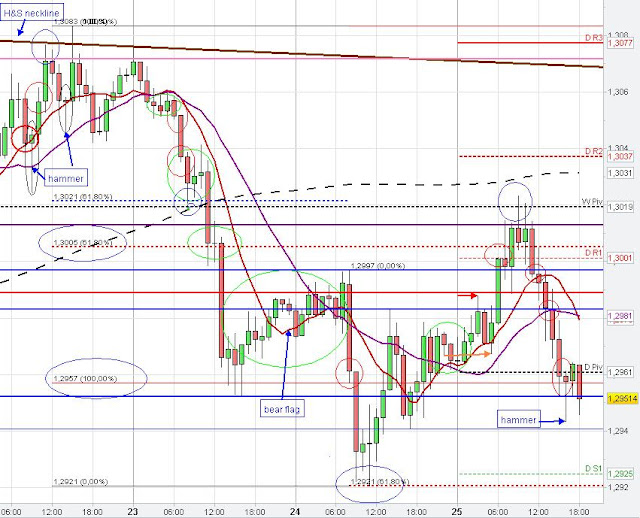
Reversal Patterns like Pin bar and Hammer Candle
Many important Candlestick Chart pattens exist, which can help determining a trading strategy. Often, candlestick patterns are used as a final trading trigger signal for a market entry or exit decision if the condition of the main trading strategies are met. So, candlestick chart patterns are often a final supplement of the overall trading strategy. To trade candlestick patterns on its own without using other technical indicators or trading strategies may be risky
In general, there are many different candlestick chart patterns. This page concentrates on the main important reversal candlestick chart patterns, which are important to know in trading. Very often these reversal candlestick patterns may occur at a major market manipulation price level - Stop Run reversal pattern. However, these candlestick patterns are also often used as fake trading signals to fool traders as the candlestick patterns are very popular trading signals, which therefore may be implemented as a fake signal by the forex manipulators.
The most important and popular candlestick chart reversal patterns are the pin bar, the hammer and the morning star and evening star candlestick pattern.
The doji candlestick pattern is often interpreted as a signal for market indecision and is therefore also often used as an indication for a potential market price reversal at the end of trends.
These reversal patterns may be used as final trading trigger signals to catch the market turning point when a market wave/ swing/ trend is ending to participate in the trend change or price retracement. These candlesticks might also be used when market is in a sideways range or consolidation pattern to trade the boundaries of the consolidation patterns or market channels. However, as the doji candle is an indication for market indecision this candlestick is very common in a consolidation pattern and thus the doji should be used with caution as an entry signal in the consolidation.
As generally known, it is not easy to catch major market turning points and trend changes, as traders, who try to catch market bottoms and market tops are often more losing than winning. One reason for this is the market price manipulation, which makes it very hard to catch the major market turning point in the forex market. The understanding of the market price manipulation in forex should be an important trading edge to separate fake and real candlestick reversal entry/ exit signals as well as to properly judge other trading signals generated by other trading strategies.
The following charts might give you an understanding how these reversal chart patterns look like and how they might be integrated in a major trading strategy.
Doji/ Evening Star Candlestick Reversal Pattern
 |
| Candlestick Pattern Doji |
 |
| Doji Candlestick Chart Pattern |
 |
| Doji, Evening Star Candlestick Reversal Chart Patterns |
 |
Candlestick Reversal Patterns Evening Star/ Doji |
Pin Bars/ Hammer Candlestick Reversal Patterns
 |
| Pin Bar Candlestick Reversal Chart Pattern |
 |
| Hammer Candlestick Reversal Pattern |
 |
| Candlestick Reversal Chart Pattern Hammer |
No comments:
Post a Comment