Price Rejection
Different types of Price Rejection
Price Rejection leads either to a pause of the trend -larger consolidation- or to a price turn around -V- shape pattern.
There are different kinds of breakout price rejections. The Pin bar candle only temporarily penetrates the Support and Resistance level before price strongly closes above/ below Support/ Resistance.
The Failed Breakout candle also does not close above/ below Support/ Resistance but the Price Rejection of the breakout candle at Support/ Resistance is less strong compared to the Pin bar.
The next type of price rejection is the unconfirmed Breakout candle. The breakout candle is successfully closing below/ above Support/ Resistance. However, the succeeding candles do not confirm the price breakout so that the chance of a price rejection is increasing.
The last type of price rejection, which is explained here, is the price rejection at the next Support/ Resistance level after the prior Support/ Resistance level already got temporarily penetrated. The next Support/ Resistance level is often the 61.80 % Fibonacci Extension level but it could also be another Support and Resistance level too. However, the kind of price rejection is explained by the Fibonacci Extension level. The price rejection occurs at the next Support and Resistance level e.g. the 61 % Fibonacci Extension so that market price recaptures the prior broken Support/ Resistance level.
The order of the different Breakout Price Rejection types goes from immediate and easy to observed price rejection (pin bar) to more complex and more time consuming price rejection types.
 |
| Pin bar |
Pin bar
Pin bars are candles with a very long wicks. This candlestick pattern often occurs around major Support and Resistance, mostly at important Highs/ Lows. Market price temporarily penetrated a Support/ Resistance level but the price breakout at the Support/ Resistance level gets strongly rejected, which creates the typical long Pin bar candle wick. Very often the bullish/ bearish pin bar candle is followed by a break of the pin bar's high/ low by the succeeding candle for either a true or false price breakout. However, Market Price Manipulation often aims to catch the stop loss orders below bullish/ above bearish pin bar candle wicks.
Failed Breakout candle
This kind of candle penetrates the Support/ Resistance level but the candle fails to close below/ above this S/R level.
Unconfirmed Breakout candle
No breakout price confirmation of the breakout candle is occurring, which means that no succeeding candle closes above/ below the range of the bullish/ bearish breakout candle. The breakout candle penetrated the Support/ Resistance level and the breakout candle closed below/ above it. However, the succeeding candle(s) do not confirm the breakout with a close below/ above the low/ high of the bearish/ bullish breakout candle.
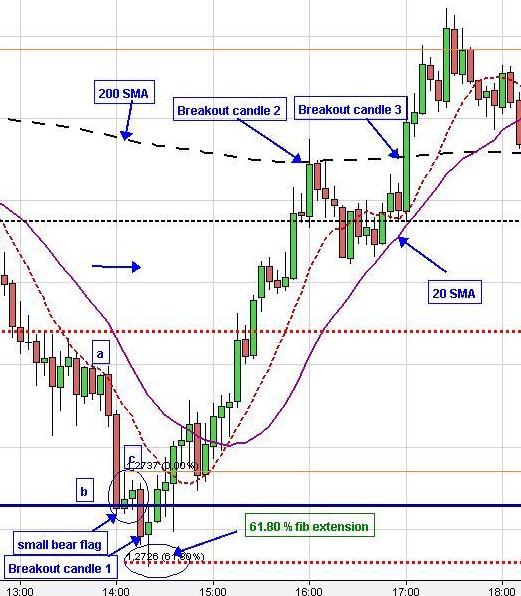
The example on the chart below shows that the succeeding candles did not closed below the low of the breakout candle 1 (no confirmation), which closed below the blue support line.
See the related Market Report about Unconfirmed Breakout candle
Rejection at the next Support/ Resistance level
- for example the 61.80 % Fibonacci Extension level
After the temporary penetration of the Support/ Resistance level market price sometimes turns around/ gets rejected at the next Support/ Resistance level, which is often the 61.80 % Fibonacci Extension. Some examples of this chart pattern are explained below.
 |
| Price Rejection/ Breakout Trading |
Examples:
If we focus on the price action on the 5 min chart above from 1 p.m. and 3 p.m. we see that the EUR/USD bounced back from the support level in a kind of V-shape pattern at 2.20 p.m. GMT. If we focus on the small bear flag on the left of the 5 min chart after market dropped from the prior consolidation at point (a) then it is observable that the last downward candles only reach the 61.80 % Fibonacci extension from a-b at point c and that the market price does not consolidate there but instead turns around and moves back into the prior consolidation pattern. Furthermore, no succeeding candle closed below the low of the breakout candle 1 (no breakout confirmation).
This kind of price pattern ( V-shape turn around at the 61.80 % Fibonacci extension and/ or non confirmation of the breakout candle) is often observable before market either turns around or at least is starting a larger consolidation pattern, particularly at strong support/ resistance.
 |
| Price Rejection/ Breakout |
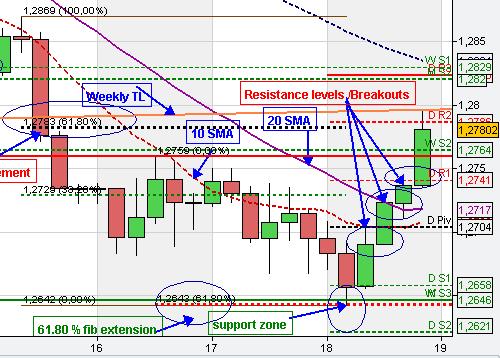
We had another example of the V-shape turn around at a 61.80 % Fibonacci extension on the 18th of May at the strong confluence support zone at about 1.2642 due to the 61.80 % Fibonacci extension from the recent swing down plus the weekly S3 (EUR/USDMarket Update 18.05.12). Furthermore, the chance of a turn around of price at the support level got also increased due to the lower downward momentum of the second swing into support compared to the first market swing down.
Continuation Chart Patterns Bull/ Bear flag | Pennants | Ledges
The Continuation patterns show that the market is unable to bounce back from the Support/ Resistance level and market erodes these S/R levels over time until the market price stops consolidating and most often continues the trend (level can not be held any more after accumulation/ distribution is over). The resumption of the trend and the termination of the continuation pattern often coincides with the beginning of a new candle of the higher time frame particularly if the previous candle closed at Support/ Resistance (Breakout Timing Strategy).
Another sign of the price breakout occurs when a strong candle closes at the Support/ Resistance level or even closes below/ above support/ resistance. As usual, a trader has to look for the price breakout confirmation and judge the price action (price pattern) to analysis whether the price breakout is true or false (Only Stop Runs).
In a strong trend the continuation patterns like bull/ bear flags can repeat over and over until a rejection of the price breakout occurs (market price moves back into the consolidation) or the continuation chart pattern fails (breakout of the consolidation pattern is to the other side). Then, a turn around of the market direction or a larger consolidation could follow.
Some Examples of the Continuation Chart Patterns
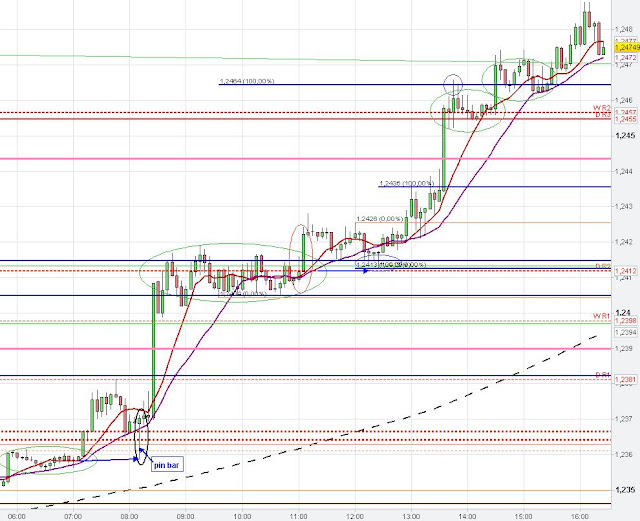
The green circles of the chart below shows many Flag patterns/ Pennants/ Ledges. The downtrend got renewed over and over again (trend pattern) with the triggering of these continuation chart patterns. Often, these trading patterns take the same amount of time as the recent related impulsive wave. As discussed before the triggering of the continuation chart pattern often coincides with the Breakout Timing Strategy).
Market report: EUR/USD Update | Euro US Dollar Technical Chart Analysis
On the 5 min chart we see many Continuation patterns (Flag patterns, Pennants, Ledges - see green circles), which got triggered and market resumed its downward trend. Very often the EUR/USD made attempts to renew its downtrend with the beginning of the new trading hour for a true or false break of support, frequently after closing at support level e.g. 8 a.m., 9 a.m. 11 a.m. 1 p.m. and vice versa for the uptrend at 3 p.m. and 5 p.m. (see red circles on hourly chart - Breakout Timing Strategy). The Consolidation pattern between 11 a.m. and 12:20 p.m. GMT can be seen as a Bear flag chart pattern of the recent impulsive downward move from 10 a.m. to 11 a.m..
 |
Another example for Continuation Chart Patterns like Flags, Pennants, Ledges:
 |
| 5 min Continuation Chart patterns - Flags - Pennants |
The two blue arrows mark Support/ Resistance levels due to the prior Consolidation price zone.
No comments:
Post a Comment