Consolidation Price Zones
Triangle Chart pattern
 |
| 4 hour Consolidation Price Zone |
Price Breakout
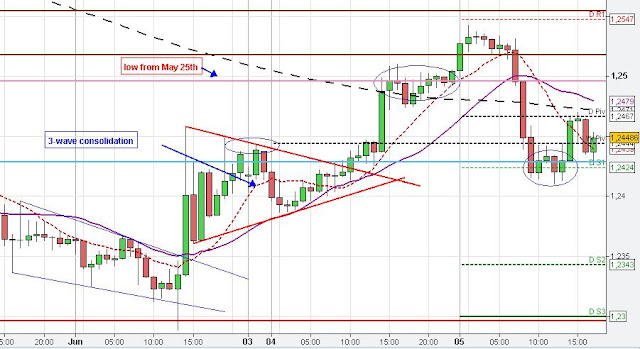
The Euro broke through the daily low of May 25th (pink line) and market found some resistance in the price zone of the prior consolidation (red circle) and the gap (brown lines) at about 1.2543. From there, the Euro returned sharply and found some support at the 20 SMA on the 4-hour chart, the consolidation (blue circle on 4-hour and red triangle on hourly chart) and daily S1 at about 1.2410.
The Euro moved up a bit to the daily pivot (1.2467) where price found resistance whereby the weekly pivot (1.2444) provided support and resistance depending on price action on the 5 min chart (not shown).
The 1 hour chart below shows yesterdays consolidation (red triangle), which gave some support in today's trading session.
 |
| 1 hour Triangle Consolidation pattern |
No comments:
Post a Comment