Price Reversal
Triangle Consolidation
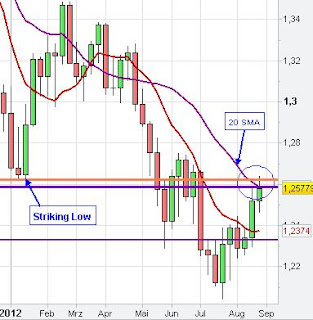
The weekly EURUSD Chart
shows the striking monthly low of January 2012. The Euro is currently trading at this striking low combined with the down sloping weekly 20 Simple Moving Average (SMA), which both is likely to act as resistance.
 |
| Weekly EUR/USD Chart Analysis |
On the 1 hour chart we see the recent price breakout to the upside out of the large triangle consolidation pattern. The EUR/USD price moved up to the first butterfly sell target (127 %), which coincides with the daily R3 and monthly R1 Pivot Point resistance.
The confirmation of the butterfly pattern would implicate a larger price reversal below the recent triangle consolidation pattern. Thus, the prior market price breakout through the upside would get completely reversed - failed breakout. The price target of the butterfly sell chart pattern is normally the 161 % Fibonacci target - see popular chart patterns.
 |
| 1 hour Butterfly pattern, Triangle Breakout |
The 5 min chart below shows the price reversal at the resistance level. The failed price breakout candles might be seen as a evening star pattern. After the initial price reversal market created a typical three wave consolidation pattern and later a small bear flag before the Euro continued the downtrend to catch the stop orders below the recent striking low - Stop Running. Often a small price retracement occurs after the penetration of an important chart level like the recent striking low to catch also some stops of the breakout traders.
 |
| 5 min False Breakouts |
No comments:
Post a Comment