Risk Disclaimer

Risk Disclaimer: Trading is risky! Never trade money you can not afford to lose! Site content is only personal opinion and never a Trade Recommendation!

Triangle Pattern

Consolidation Price Zones


Triangle Chart pattern


EUR/USD Consolidation Price Zone
4 hour Consolidation Price Zone


Price Breakout


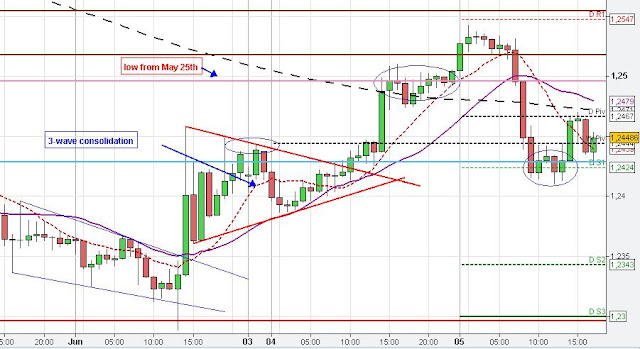
The Euro broke through the daily low of May 25th (pink line) and market found some resistance in the price zone of the prior consolidation (red circle) and the gap (brown lines) at about 1.2543. From there, the Euro returned sharply and found some support at the 20 SMA on the 4-hour chart, the consolidation (blue circle on 4-hour and red triangle on hourly chart) and daily S1 at about 1.2410.

The Euro moved up a bit to the daily pivot (1.2467) where price found resistance whereby the weekly pivot (1.2444) provided support and resistance depending on price action on the 5 min chart (not shown).

The 1 hour chart below shows yesterdays consolidation (red triangle), which gave some support in today's trading session.
Triangle Consolidation pattern
1 hour Triangle Consolidation pattern

Ending diagonal pattern

Fibonacci Chart Patterns


Fibonacci extension level


Fibonacci extension level
4 hour Fibonacci extension levels

On the 4 hour chart (left) we see that the 100 % fib extension from A-B at C and the weekly S2 provided support and the Euro returned sharply from this level.

The hourly chart below shows that the Euro formed an ending diagonal (wave C-D) after the termination of the impulsive A-B wave plus the succeeding correction wave up to point C.

The last wave of the ending diagonal (e) penetrated the weekly S2 and the 100 % fib extension (red line) (no confirmation) before the Euro turned around sharply and immediately moved up to the initial price target at point C-blue line (beginning of the ending diagonal).


Elliott wave theory, ending diagonal pattern
1 hour Elliott wave theory, ending diagonal pattern


ending diagonal pattern
5 min Ending diagonal pattern


100 % fib extension


On the 5 min chart we see that the Euro moved up sharply after reaching the support zone at the 100 % fib extension (red line) and that market ignored all resistance levels in between to move directly to the initial price target (beginning of the diagonal). This price behaviour is typical after a pattern terminated, particularly an ending diagonal (directional move). In the following market found support at the 100 % fib extension of A-B at C and resistance at the 100 % fib extension of D-E at F plus the weekly S1.
Back to top