Risk Disclaimer

Risk Disclaimer: Trading is risky! Never trade money you can not afford to lose! Site content is only personal opinion and never a Trade Recommendation!

Fib extensions

Trading the Fib extension levels 

Important Fib Extensions: 61.80 % 100 % 161 % 


Candlestick pattern Doji
Daily Candlestick pattern Doji

Yesterday, the Euro found resistance at January's low 2012 (orange line) and the 61.80 % fib retracement of the recent swing (EUR/USD Market Recap 07.06.12).

Yesterday's daily candle could not close above the 20 SMA and closed in the price range of the prior daily candle (false breakout). Furthermore, market formed a Doji bar or evening star chart pattern, which led to a sharp drop in price in today's Asian and European session.


Weekly Pivot point S/R
1 hour Weekly Pivot point S/R

Fibonacci Levels and Fibonacci Trading

On the hourly chart we see that the sharp price drop started at 1 a.m. GMT ,right after yesterday's daily doji bar closed. The Euro got initially pushed down by the 10 SMA and 20 SMA. The price drop at 1 a.m. triggered the bear flag (blue circle) and the Euro moved to the 100 % fib extension (A-B at C ) and formed the second bear flag (D) at the green trend line and the 100 % fib extension (also 61.80 % fib retracement).

In the following, the Euro broke put of the bear flag and resumed it's down trend  to the weekly pivot point. (EUR/USD respected the resistance in form of a bear, which means that market could not sufficiently bounce back from support-bearish signal). Recently, market respected (touched) the hourly 10 SMA (green circle) at 3 p.m. and broke through it with the next hourly candle. The 4-hour candle closing at 4 p.m. also looks like a doji (support at the weekly pivot).

ending diagonal, bear flag, chart analysis
5 min ending diagonal, bear flag


On the 5 min chart we see the different bear flags (circled). After EUR/USD broke out of the first bear flag (blue circle) the Euro went to the 161,80 % fib extension (1-2 at 3) where market formed the second bear flag (red circle).The Euro broke out of the bear flag and went to the 100 % fib extension (5-6 at 7).

The EUR/USD found support at the weekly pivot (slightly penetrated but no confirmation, stop fishing below the low of June 6th-blue line) where it formed a kind of ending diagonal ((8-impulsive,9-correction, abcde-ending diagonal). The correction high (9-green line) is the initial target after the ending diagonal terminated, which market reached quickly (directional move). Recently, the Euro found resistance at the daily S2 (1.2492-not shown), the prior consolidation (red circle) and particularly the 61.80 % fib retracement (5-e-not shown) at 1.2493.

Weekly Chart Analysis

Weekly and Daily Analysis


Inverted Head and Shoulders


EUR/USD weekly chart analysis
Weekly Chart Analysis

EUR/USD daily chart analysis
Daily Chart Analysis


On the weekly chart we observe that the Euro moved up to the January 2012 low (orange line).

On the daily chart we see that EUR/USD respected (closed at) the 20 SMA yesterday and today price moved above the 20 SMA up to the January's low at 1.2624 (orange line) and the 61.80 % fib retracement at 1.2620. This resistance zone held the Euro and price fell back from this level into the price range of yesterday's daily candle. EUR/USD already failed to recapture the low from January 2012 on May 28th (recent high from May 28th coincides with January's low).

EUR/USD forex chart analysis
1 hour EUR/USD forex chart analysis

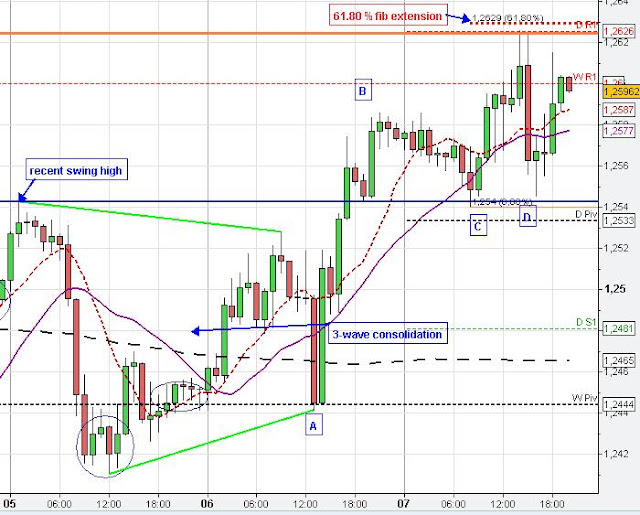
On the hourly chart (above) we see that the Euro started today's up move from the recent swing high at 1.2543 (blue line-C). After the back test of this level (resistance became support-C) EUR/USD moved above the weekly R1 but market found  resistance at the orange line (low from January 2012), 61.80 fib retracement, daily  R1 and the 61.80 % fib extension (A-B at C)

Overall, the Euro could not overcome this resistance zone at about 1.2624 and in the following price sharply fell back from resistance at 4 p.m. before price found solid support at at the 10 SMA on the 4 hour chart at 1.2546 (4 p.m. candle-not shown) closely to the recent swing high (blue line-support-D) at 1.2543.

Inverted head and shoulder pattern
5 min Inverted head and shoulder


On the 5 min chart we see that EUR/USD formed a typical 3 wave consolidation pattern at the price level of the weekly R1 (between 1-2 p.m.) before the Euro resumed it's uptrend terminating at the resistance zone. The Euro reversed sharply and took out the recent striking low at 1.2562.


Inverted Head and Shoulders chart pattern

The recent consolidation from the beginning of today's European session (8 a.m. - 10 a.m.-not shown) provided some support and led to a pause of the sudden price drop before market headed up again at 4:35 p.m. after price reached the 10 SMA on the 4 hour chart (not shown). The Euro formed a kind of inverted Head & Shoulder (3,4,5), which got triggered and market moved up to the consolidation pattern at today's high (6).

Back to top