Elliott Wave pattern
Ending Diagonal
Elliott Wave Analysis - Ending Diagonal
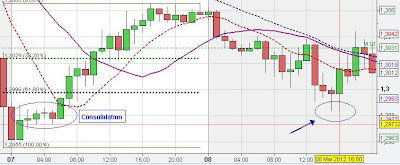
We had the Ending Diagonal as an important Elliott wave pattern (or without using the Elliott wave analysis terms also called a Three-Drives pattern) on the 5 min chart (C-Wave of the ABC retracement) at the beginning of the US trading session. The Ending Diagonal terminated at the 61.80 % Fibonacci Extension of wave A at 1.2983 (5 min chart analysis).
The internal waves/ swings down of wave C lost strength and got shorter. The typical impulsive up move after the termination of this Elliott wave pattern (Ending Diagonal) found resistance at the 200 SMA on the 5 min chart analysis.
A further support zone besides the 61.80 % Fibonacci Extension at the termination point of the final wave C was the price zone of the prior flat consolidation pattern visible on the hourly EUR/USD Chart below. These Consolidation zones often proide Support/ Resistance when market price retraces into this zone for the first time.
The Ending Diagonal similar to the Three-Drives-Pattern are chart patterns, which fit well into the
Market Price Manipulation in Forex.
These Chart patterns illustrate the process of market manipulation in regards of targeting/ taking out the stop orders (Stop Runs) and fooling breakout traders.
 |
5 min Ending Diagonal analysis
|
 |
| 1 hour EUR USD Trading Analysis |
Some further Chart Analysis examples with the Ending Diagonal Chart pattern
Monthly Support on the Euro US Dollar Chart and an Ending Diagonal pattern (Elliott wave theory)
 |
Monthly EUR/USD Support Resistance
|
 |
| 1 hour Euro chart analysis |
On the monthly chart we see that the monthly candle (May) closed at the low from 2008. On the hourly chart we see that EUR/USD turned around at the 61.80 % fib retracement and that market in the following took out the previous low at 1.2358 but did not confirm the breakout (stop fishing) and instead created a bullish doji candle.
 |
5 min EUR/USD Ending Diagonal Elliott Wave Pattern
|
On the 5 min chart we see that EUR/USD created a kind of inverted Head and Shoulders "overnight" (A-B), which got triggered. The up move terminated at the hourly 61.80 % fib retracement (blue line) and market formed an ending diagonal (Elliott wave pattern) at the resistance (wave E). Ending Diagonals are normally preceeded by an impulse wave (C) and develop as the second trend wave of an ABC or as the "5th wave" of an impulsive pattern. The initial target after termination is often the start of the Ending Diagonal (D) (green line).
EUR/USD took out the previous low (red line). The breakout candle is very strong as many stops below the low got triggered, however, there is no confirmation of the breakout on the 5 min chart. Market reversed and found some resistance at the 200 SMA
Another Ending Diagonal Triangle
Ending Diagonal pattern on the Euro US Dollar Chart
EUR/USD market formed an Ending Diagonal pattern (C-wave) and the Euro reached the standard target, which is the complete retracement of the C-wave (below point B) at 1:55 p.m. GMT (also trendline-support).
 |
| 5 min Ending Diagonal pattern |
Another Diagonal with impulsive move after termination of the diagonal triangle pattern
 |
5 min Ending Diagonal chart analysis
|
On the 5 min EURSD technical chart we see that market made an abc retracement from the support zone (Z)
(EUR/USD techncial chart analysis update 29.05.12) up to the 100 % fib extension (A) before market moved lower (B). In the following market retraced up to the 200 SMA and the small "overnight" consolidation (C ).
The following wave structure looks like an ending diagonal, which terminated at the 100 % fib extension (A-B at C) before the upward breakout to the 200 SMA occurred (E). However. the 200 SMA and particularly the 20 SMA on the hourly (not shown) provided resistance and market reversed down again, firstly to the 61.80 % fib extension and secondly to the 100 % fib extension from F-G at H. Quite often, the move down got triggered by the 20 SMA e.g. at H and I after the termination of the 3-wave consolidation pattern (circled).


