Risk Disclaimer

Risk Disclaimer: Trading is risky! Never trade money you can not afford to lose! Site content is only personal opinion and never a Trade Recommendation!

Candlestick patterns Hammer and Evening star

Hammer and Evening Star


Evening Star and Hammer Chart pattern


Evening Star pattern
4 hour Evening Star pattern

EUR/USD

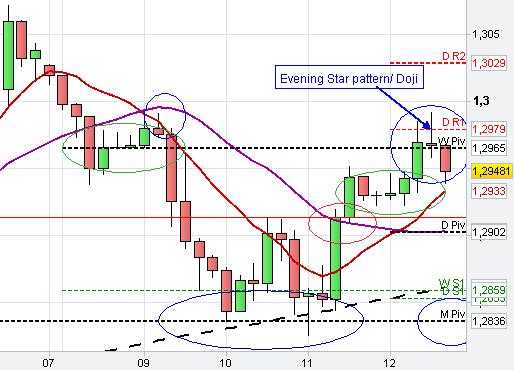
retraced up to the weekly Pivot point where market formed a kind of Evening Star pattern and market price started to turn around.

On the 1 hour Euro US Dollar chart (last 10 candlesticks) we see how market closed at support and breached it with the beginning of the new hourly candle [Breakout Timing setup-red ellipses, market closed at each support level (10 SMA, 20 SMA and daily pivot point)] and broke through it with the new hourly candle).

The repeated pattern of a bearish candle close at a support level and the following break of this support level with the beginning of a new candle often occurs in a strong bearish trend or a surge in downside momentum.

hammer candlestick
1 hour Hammer candlestick


Pivot points
5 min Pivot points

Important psychological chart levels

1.30 price zone in EURUSD


Trading Important Chart levels


The Euro

found resistance at the Head and Shoulders neckline yesterday and formed a Three Drives pattern (see 1 hour chart). From this top, the EUR/USD moved down whereby the downside momentum increased today.

The hourly 200 SMA, the daily S1 and the weekly Pivot point provided temporary support for the Euro before the market moved lower to the psychological important 1.30 level.
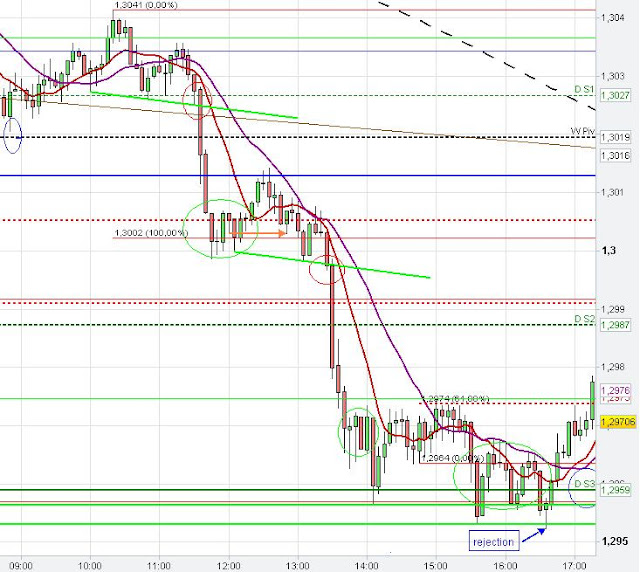
Many stops can be anticipated below this major psychological level so that at least a temporary breach of this support level could happen to clear some stops. The 61.80 % fib extension at 1.3005 on the 4 hour EUR/USD chart got respected by the 4 hour candle starting at 8 a.m. GMT before the new 4 hour candle breached this important psychological 1.30 level (Timing setup).

The strong 5 min momentum candle at 1.30 p.m. shows the momentum created by the stop triggering and the follow through. The EUR/USD went lower to the next major support level at around 1.2957 created by the 100 % fib extension and the 200 SMA on the 4 hour chart and the daily S3, which supported the Euro US Dollar so far.

On the daily Euro chart we have a potential bearish "222" Gartley pattern.


Fibonacci extension
4 hour Fibonacci extensions

gartley pattern
Daily Gartley pattern
Head and Shoulder
1 hour Head and Shoulders pattern 
 
neckline break
5 min Neckline break, Momentum

Head and Shoulders pattern and Neckline

Chart Pattern targets


Neckline of the Head and Shoulders 


Euro US Dollar

triggered the Head and Shoulders pattern with the break of the neckline and the Euro moved lower to the Head and Shoulders target, which is marked on the chart with the 100 % Head and Shoulders target. From there, the market retraced back up to the Head and Shoulders neckline and formed a kind of Wedge pattern / Three Drives pattern before the EURUSD reversed and moved down again (right side of the chart).

Overall, the two hammer candle stick pattern (right side of the hourly chart) and the 61.80 % as well as the 100 % Fibonacci extension levels on the 5 min chart helped us in predicting support and resistance zones.

The first hammer candle  occurred at the consolidation price zone of the prior flat "overnight" consolidation pattern of the 21th of October, which acted now as support. The price up moves after the first and the second hammer candlestick created the kind of Wedge/ Three-Drives pattern and market reversed to the downside after the Euro touched the brown neckline of the Head and Shoulders  at around 1.3080.

As often, market penetrated an important Chart level like the neckline and the high of the recent overnight consolidation zone of the 19th of October to clear the stop orders and trigger the limit breakout orders before reversing strongly (False Breakouts - Market Manipulation).


Head and Shoulder, wedge pattern, Three Drives pattern
1 hour Head and Shoulders pattern, Fibonacci target


The Wedge / Three-Drives Pattern is better visible on the 5 min chart. Furthermore, we had two Head and Shoulders pattern on the 5 min chart, see the red lines marking the Head and Shoulders pattern. Both patterns worked out relatively well.

The useful Fibonacci extension levels (61.80 and 100 %) are also visible on the 5 min chart below.


Head and Shoulder
5 min Head and Shoulders pattern and Wedge

See also Chart Pattern Manipulation to understand that famous chart patterns are tricky.

The Technical Chart Analysis of the trading days before below


The EURO


found support at the Head and Shoulder price target (100 % fib extension of the Head and Shoulders  height moved to the neckline break), daily S2 and 100 % Fibonacci swing projection. Pivot Points and Fibonacci extension levels only held the market temporarily. The red ellipses underlined the Breakout Timing Strategy (Break of support of the new hourly candle after previous hourly candle closed bearish at the support level).

Head and Shoulder target
1 hour Head and Shoulders pattern target


three drives pattern, head and shoulder target
5 min Three Drives pattern


The Developing of the Head and Shoulders pattern


Head and Shoulders neckline and Fibonacci Analysis


on hourly chart but neckline and daily S1 held the market so far. The Euro found resistance at the weekly S2.

In today's session the Euro often found resistance and support at 61.80 % and 100 % Fibonacci extension levels and market often cleared the stops (stop fishing - false breakout) below recent lows (see red arrows on 5 min chart).


The Fibonacci Extension and Retracement levels as well as the Pivot Points revealed important Support and Resistance zones (5 min chart analysis)


Head and Shoulder pattern
1 hour  Head and Shoulders neckline

Head and Shoulder pattern
1 min  Head and Shoulders pattern

fibonacci extension, stop fishing, chart
5 min Fibonacci levels 


Typical Consolidation Pattern

Consolidation Price Zones 


Consolidation Patterns with three Swings


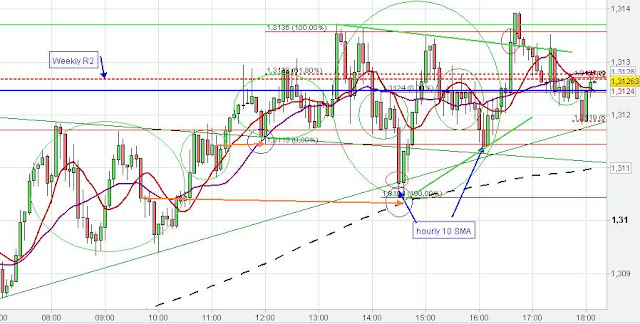
IF you observe the consolidation patterns (green circle) then you will recognize that most of them consists of three waves/ swings (Typical consolidation pattern) before the consolidation terminates and price renews its prevailing trend. Very often these consolidation price zones also provide some support/ resistance when price captures this price zone again for the first time (orange arrow). More information about Consolidation patterns and Consolidation price zones are at: Support and Resistance Chart Patterns

typical consolidation pattern
5 min Typical Consolidation Pattern

Three swing Consolidation formation


The Chart pattern analysis below again shows the typical three swing/ wave consolidation patterns (The two large ellipses illustrate the typical three swing consolidation formations), followed by the breakout of price in trend direction after the termination of this consolidation formation type.
typical consolidation pattern

Consolidation price zones in the EURUSD


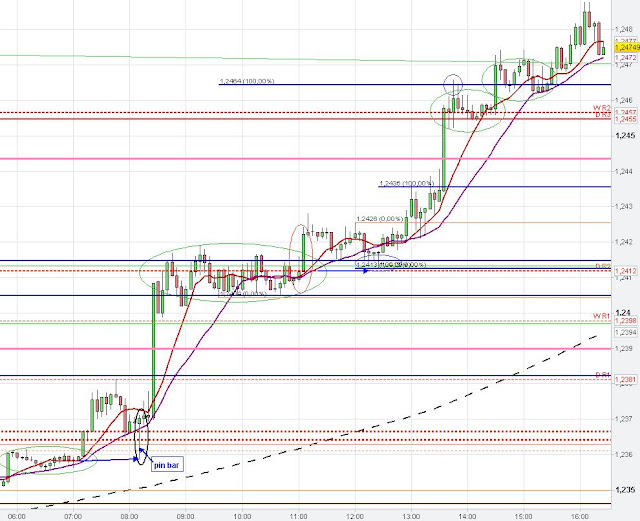
On the 5 min chart of the EUR/USD  below we see the formation of the pin bar candlestick pattern at the price zone of the recent consolidation pattern.The Euro moved up strongly and price momentum recedes during the formation of the larger consolidation pattern at the daily R2 Pivot (green ellipse). The price breakout of the larger consolidation  (red ellipse) occurred at the beginning of the new hourly candle (11 a.m.) (Breakout timing).

However, the price breakout was very shallow and market retested the consolidation price zone (blue arrow) before the Euro started to moved up further to the next smaller consolidation pattern at the daily R3 Pivot, the weekly R2 Pivot and the 100 % Fibonacci Extension level.

EURUSD Analysis
5 min Euro Analysis, Pin bar, Consolidation pattern


Typical three swingconsolidation/ continuation pattern on the 5 min chart


Potential Inverted Head and Shoulders pattern

The Euro moved lower and created a typical three swing consolidation pattern around the 100 % Fibonacci Extension level. Price broke out of the three swing Consolidation pattern at the beginning of the new hourly and 4-hourly candle (red ellipse), which is often an important Breakout Timing (GMT).


The EUR/USD found support at the 61 % Fibonacci Extension of the recent swing down moved to the high of the consolidation pattern. Market formed  a kind of inverse Head and Shoulders pattern, which might led to the price reversal of the EUR/USD to the upside

Inverted Head and Shoulder
5 min  Inverted Head and Shoulders pattern

Butterfly Sell chart pattern

Butterfly Sell price target


EUR/USD Technical Chart Analysis


On Friday, we had a perfect butterfly sell chart pattern. Today, the Euro initially went down (Evening Star chart pattern from Friday) and found support at the 61.80 %  fib retracement (1.2889) and resistance at the hourly trend line (blue).

Butterfly sell pattern
1 hour Butterfly sell pattern

Typical Consolidation Pattern


On the 5 min EURUSD Chart below another typical three swing consolidation pattern is visible just at the daily Pivot Point support. The breakout of the consolidation pattern occurred with the start of the new hourly candle at 12. a.m. (Important Timing Point). The up move of the Euro found resistance at the hourly downward sloping trend line.


Interestingly, the consolidation pattern and the false breakout to the 161 % Fibonacci level at 1.2979 is very similar to the butterfly sell chart pattern. After the false price breakout to the upside to the major 161 % butterfly sell target market reversed and retraced the up move. The Euro targeted the final 161 % butterfly sell target at 1.2940, where the EURUSD paused a while before market continued the downward move to the weekly Pivot Point. The weekly Pivot provided solid support (together with the 100 % Fibonacci Extension level of the recent swing at 1.2932) and the Euro bounced back up to the daily Pivot Point.

Overall, the daily Pivot Point provided solid support at 11 a.m.. After the confirmed break of the daily Pivot to the downside at around 3 p.m. the daily Pivot changed its role from support to resistance as often after a confirmed break of important chart levels.


hourly resistance, 20 sma, daily pivot
5 min EURUSD Analysis

Butterfly price targets

Trading the Butterfly pattern


A Butterfly chart pattern was in today's Forex trading session in the EUR/USD on the 5 min chart (last chart).

The Euro found resistance at the 127 % butterfly sell target (5 min chart) and from there the EUR/USD went straight to the 161 % butterfly pattern target. The consolidation price zone of the triangle pattern (hourly chart) and the hourly 200 SMA also gave some support at the 161 % butterfly pattern target at around 1.2940.

On the 4-hour chart we see an Evening Star pattern.

Evening Star pattern
4 hour Evening Star pattern

triangle breakout
1 hour triangle breakout


perfect butterfly sell pattern
5 min butterfly sell pattern

Inverted Head and Shoulders

Inverted Head and Shoulders neckline


The Euro found support at the monthly pivot and resistance at the daily pivot. On the 5 min chart we see a nice bull flag at 12.30 p.m.. Market also found support at the uprising trend line (green) on the 5 min chart. The downward sloping 20 SMA (purple line) on the hourly provided only temporary resistance during the formation of the right shoulder of the head and shoulders formation.

On the 5 min EUR/USD chart we see many Continuation patterns (green ellipses). The ongoing trend paused during these continuation patterns (mainly Flags and Pennants)  until the Continuation pattern got terminated (mostly after three swings).

The 5 min and the hourly Chart also show how market reversed at the daily Pivot Point.<


Inverted Head and Shoulder
1 hour Inverted Head and Shoulders pattern

inverted head and shoulder, neckline,  pin bar
5 min EUR/USD Chart Analysis, Pin bar

Fibonacci levels and Bear Flags

Fibonacci extension levels


Flag patterns


The EUR/USD Chart Analysis

shows the importance of the 61.80 % and 100 % Fibonacci extension levels, which market often respects as support/ resistance, at least temporarily. On the hourly Euro Chart we see that market respected the 61.80 % Fibonacci Extension level at 8 a.m..Market retraced up from this Fibonacci Extension level to the downward sloping 20 SMA (purple line) and the 61.80 % Fibonacci retracement level. From this resistance level, which market approached at 1 p.m., the EUR/USD rolled over and continued its downward trend to the 100 % Fibonacci Extension level. The 61.80 % Fibonacci Extension level often provides only temporary support/ resistance. The 100 % Fibonacci Extension support level got further strengthened due to the weekly S1 at 1.2859.

fibonacci extension
1 hour Fibonacci extension levels

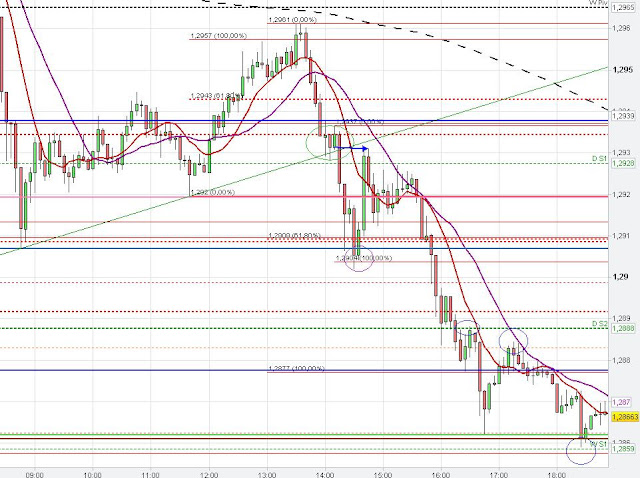
On the 5 min Chart we see that the EUR/USD consolidated at the uprising trend line and the daily S1, formed a bear flag (Continuation pattern) and market finally broke through the support level of the uprising trend line. Market took out the stops and triggered the limit breakout orders below the recent low (left side of the 5 min chart) and the Euro started to retrace back into the Consolidation zone (Market Price Manipulation) of the prior bear flag, which now acts as resistance (Consolidation price zones). Furthermore, the daily S1 changed its role from support to resistance after the confirmed break of this level on the 5 min chart.
trend line break, chart analysis, euro
5 min EUR/USD Chart Analysis

Another EUR/USD Chart Analysis in regards of Fibonacci Extension levels and Bear flag pattern:

Fibonacci Extension
4 hour Fibonacci Extension

Fibonacci and Bear Flag

continued its down trend today with the triggering of the bear flag pattern. The 10 SMA on the 4 hour chart provided resistance to the Euro and the  EURUSD depreciated further. The Euro found support at the daily S1 and 61.80 % Fibonacci extension (1 hour chart) and market turned around after the creation of the hammer candlestick pattern on the 5 min chart. The EUR/USD moved up to the prior consolidation price zone (bear flag - hourly chart-orange arrow), which acted as resistance.


EURUSD Chart
1 hour Bear Flag pattern, Hammer


EURUSD Analysis
5 min Hammer pattern

Butterfly pattern and price targets

Butterfly Sell pattern


Weekly and Daily Pivot


The Euro


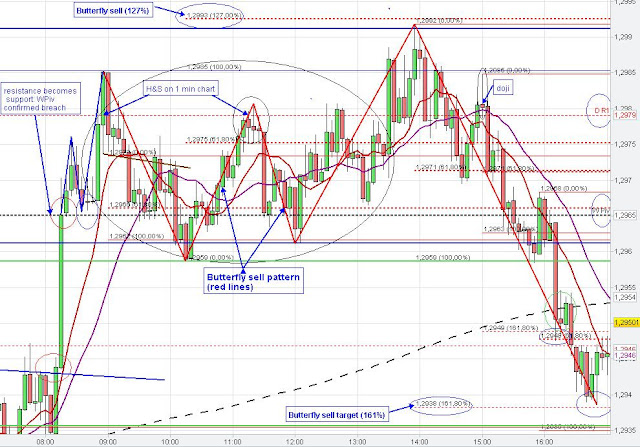
formed a butterfly sell pattern on the 5 min chart. The turn around at the 127 % butterfly sell target coincided with the 61.80 % fib retracement on the hourly chart and the weekly R1. We also see the importance of pivot points for example of the weekly and daily pivot and daily S1 and weekly R1.

Market initially moved down at 8 a.m. to find support at the weekly Pivot Point. From the weekly Pivot the Euro bounced up strongly, creating a small bull flag at around 8:45 a.m.and later the Butterfly sell pattern. 

The Butterfly pattern is a typical reversal chart pattern so that market typical retraces the preceding move after the failed breakout to the 127 % or 161 % Fibonacci extension level from the preceding Consolidation pattern at 10 a.m.. The Euro retraced back to the typical 161 % Butterfly price target, which also coincided with the 61.80 % Fibonacci retracement level of the recent swing up at around 1 p.m.at 1.29. 


The Euro consolidated above the 1.29 price level with the typical three swing consolidation before breaking temporarily through the 1.29 level (psychological level). Later in the US session the Euro has been in a choppy trading environment with the daily Pivot as the upper border and the 1.29 price level as the lower border.


butterfly sell pattern, butterfly target
5 min Butterfly Sell Pattern, Butterfly Price Target

Importance of the 200 SMA

EURUSD Technical Chart Analysis 


The 200 Simple Moving Average


The Euro


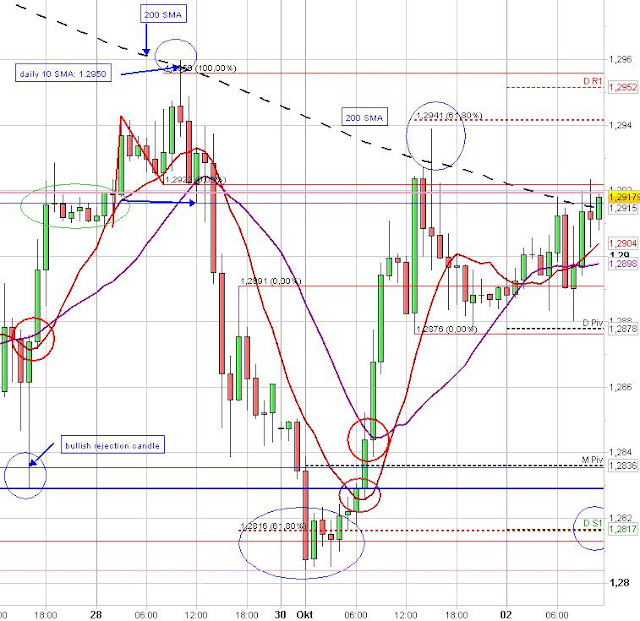
found resistance at the downward sloping 200 SMA (Simple Moving Average) and support at the daily S1 after market took out the stops and triggered the breakout limit orders below the recent low on the left side of the chart (blue line). After the Stop Run - Market Manipulation - got accomplished there was "nothing" to hold back the Euro from rising upwards. The resistance of the recent low (blue line) and the 20 SMA (purple line) got respected and broken with the beginning of the new hourly candle (Breakout Timing). For example market closed at the 20 SMA resistance with a strong candle and the EUR/USD broke through this resistance level with the beginning of the new hourly candle at 8 a.m. on the 1st October.


In general, the 200 SMA is often acting as support/ resistance and the 200 SMA shows the larger trend direction if the SMA, particularly when this Simple Moving Average is strongly sloping. Otherwise, the 200 SMA indicates a sideways range bounded market when the 200 SMA is more flat than sloping.


200 sma, bullish rejection candle
1 hour 200 SMA

Back to top