False Breakouts to catch Stops
Stop Fishing in Forex
 |
| 1 hour Stop Fishing | False Breakouts |
The Euro
penetrated the monthly pivot (second test) but closed above it on the hourly chart (rejection). From there the Euro tried to break to the upside but market could not break the orange line (January low). The penetration of the recent pivots (low, high - red circle on hourly chart) and thus the stop fishing on both sides very often precedes larger moves in the market as most of the traders are already stopped out or trapped in the wrong position.The failed break to the upside (orange line) with the clearing of the stops above the recent high (1.2614) of the short positions led to a third test of the monthly pivot today, which got already penetrated at the second test (weaker now). Some indication for a break of the monthly pivot were the facts that it was already the third test, the hourly close of the 11 a.m. candle below the monthly pivot and the confirmation of the break at 12 a.m. on the 5 min chart and at the 3 p.m. hourly candle close (lower close than the range of the breakout candle-blue circle on hourly).
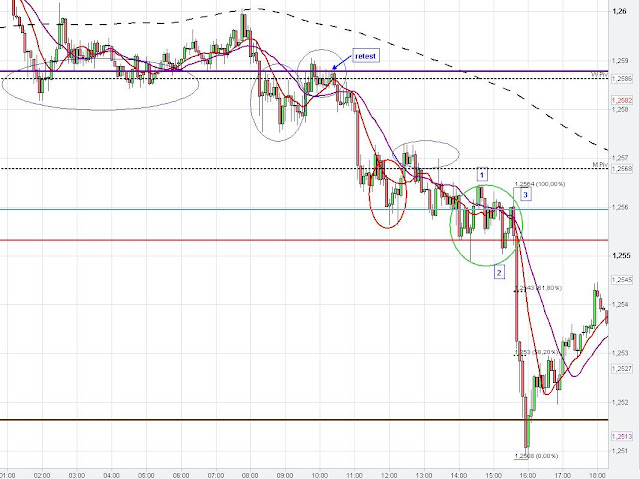
The blue circle on the 5 min chart at 1 p.m. shows how the monthly pivot started to act as resistance now and the green circle shows a typical 3-wave consolidation pattern before market impulsively moved down. The Euro found some support at 61.80 % fib retracement of the recent swing up at 1.2517 (brown line) and from there the Euro retraced up to the 61.80 % fib retracement of the recent impulsive wave down at 1.2543.
The consolidations below the weekly and monthly pivot on the hourly chart can be seen as bear flags.
Prior to the impulsive wave down market penetrated the recent lows (blue and red line), which often gives some short term support (see the candles with the long wick which penetrated these levels (12, 12:15, 14;20 p.m.-stop fishing accomplished).
Weekly and Monthly Pivot Point
On the 5 min chart (below) we also see the changing role from support to resistance of the weekly pivot and the August 2010 low (purple line). This price zone provided support in the Asian session (ellipse) before market breached this level (9 a.m.) and retested it at around 10 p.m. (now resistance).
 |
| 5 min EUR/ USD Chart analysis |
No comments:
Post a Comment