Risk Disclaimer

Risk Disclaimer: Trading is risky! Never trade money you can not afford to lose! Site content is only personal opinion and never a Trade Recommendation!

Flag Patterns, Pivots and SMA

Chart Analysis of the Euro


Daily Pivot Point


euro us dollar chart analysis
1 hour Fib Extension

Price Zone of the Consolidation pattern


 Today in the Asian session EUR/USD went lower but market found support at the gap close from the trading day before at 1.2518 and the tight price zone of the consolidation pattern at this price level (Z).  The Euro moved up from this support price level (C) and penetrated the daily pivot point (1.2563) (D) but found resistance in the price zone of yesterday's consolidation pattern (B). Since then EUR/USD is trading lower.

euro us dollar chart analysis
5 min Euro us dollar chart analysis


Bull flag

 On the 5 min chart we see that yesterday's consolidation price zone at about 1.2540 (1) provided some resistance (2) before market went up further. The daily low from May 23 at 1.2545 (red line) still seems to have some impact (red circles). Market consolidated (3) (Bull flag) and closed (7 a.m. hourly candle) at the red line before market broke out of the bull flag initially at the beginning of the new hourly candle at 8 a.m.(breakout candle).

The breakout candle respected (closed at) the daily pivot point, consolidated there (4) and broke through it triggered by the increasing 10 SMA on the 5 min chart. However, the breakout of the following small bull flag (5) just above the pivot point only reached the 61.80 % fib extension (a-b at c) (rejection) and the Euro turned around. Market price respected and then moved below the 10 and 20 SMA on the 5 min chart.

The EUR/USD market traded in a tight 20 pip range between 11 a.m. and 1 p.m. capped by the 200 SMA before market created a typicalthree swing consolidation pattern (ABC), which also can be regarded as a bull flag from the previous swing down (hourly chart) (the first swing/ wave (A) in the consolidation terminated at the 61.80 % fib retracement; the second wave (B) at the 61.80 % Fib extension from the previous swing down at A).

After the three swing consolidation pattern terminated (C) market broke down strongly (high momentum) and market took out the previous lows, particularly the recent low from 25th of May at 1.2496 (blue line). Market only initially respected the support zone of the daily S1, low from 25th of May and the 100 % fib extension (4:35 p.m.) before the Euro moved down further to find some support at the daily S2 pivot, the hourly 100 % fib extension (A-C at D) and the 161 % fib extension on the 5 min chart.


10 and 20 SMA


During the strong move down (5 min SMA's were far away from price) the 10 and 20 SMA's on the 1 min chart (not shown) seem to become the trigger signals, e.g. at 4:41 p.m. (6), as long as the momentum stayed strong and market did not reject the decreasing SMA's on the lower time frame-1 min-.


Gap Trading and Fibonacci Analysis

Fibonacci levels


How to trade a market gap


After the recent price rejection and the taking out of some major market lows (, the EURO consolidated in the price range zone around 1.2550 during recent trading days (see 4-hour chart). The recent market low from Friday's trading session at 1.2496 occurred at the 100 % Fibonacci Extension from A-B at C and the round number -1.25 (4-hour chart).


Forex Gap Trading
4 hour EURUSD  Market Gap Trading

EUR/USD Gap Analysis
1 hour Forex  Market Gap Analysis

The pice gap down


The EUR/USD market gaped up and found resistance at the market low from January 2012 at 1.2625 (pink line). Market price slightly penetrated (3) the high from the 24th of May (stop fishing) at 1.2620 before market price turned around.

On the hourly chart, the circled consolidation during the Asian session (2), the 20 SMA (hourly-purple line),  daily R1 plus the 200 MA on the 5 min chart held the market for a while before EUR/USD broke down at 2 p.m. (5).

Market respected (hourly close at) the support level of the red line (market low from May 23 on the hourly chart), the green trend line at 1.2545 (hourly chart) (4) and also the 61.80 %  Fibonacci Retracement, 100 % Fibonacci extension, the daily pivot point at this support zone (red circle) before market price went down a bit further immediately in the beginning of the new trading hour at 3 p.m. (Breakout Timing). However, market price seems to consolidate around this key support level and might calm down on today's US Memorial day.

Friday's close at around 1.2518 (Market gap close) and the surrounding consolidation (1) might provide some further support.


Euro US Dollar  technical chart analysis
5 min Euro US Dollar  technical chart analysis

Breakout Confirmation

Un-/ Confirmed Breakout Candle


Fib Retracement and Fib Extension


Failed Breakout candle


On the hourly chart we see that we consolidated (ABC) again "overnight", however, this time we broke the consolidation to the upside, which lifted the market up to the daily R1 at 1.26 (D) before market turned around and breached yesterdays low (orange line-E). Market found some support at the weekly S2, daily S1 and the 100 % fib extension (Z-A at D) in the American session.


The red line on the hourly chart shows the important low (23 May) after the recent impulsive move down. Yesterday's two breakout candles (at 8 a.m. and 6 p.m.) did not get confirmed by a lower close of the succeeding candles below the range of the breakout candles on the hourly chart. The purple line shows the low of the second  breakout candle which did not get confirmed by a close below this line/candle during the consolidation. This non confirmation might be a reason for the upside breakout of the consolidation.


Explaining Technical Chart Analysis
1 hour Explaining Technical Chart Analysis


The following upside swing on the hourly chart above (7 a.m.) respected the 61.80 % fib retracement from the prior down swing (Z-A) with the close of the 8 a.m. hourly candle (F) at this level (1.2582) before the succeeding hourly candle made a false breakout (closed inside of the body of the preceding hourly candle and no Breakout Confirmation on the 5 min chart).

Today's high was the end of the larger three wave consolidation pattern (triangle ZCD green lines)) which started after yesterdays false breakout at 9 a.m, where price turned around in a V shape pattern at the support level + 61.80 fib extension.


Understanding Technical Chart Analysis in Forex
5 min Understanding Technical Chart Analysis in Forex


On the 5 min chart we see that the breakout candle at 9:10 a.m. (1) (after the prior hourly candle closed at the 61.80 % fib retracement) did not get confirmed. Market consolidated between 10 and 11:15 a.m. and price broke down and moved to the 100 % fib extension (ab=cd)  at (2). The prior consolidation gave resistance to the following upside swing (3) and market reversed and went down with strong momentum. We see that market tried to defend the red line (low from two days ago) (4), however, market dropped down strongly at 1:25 p.m..

The Euro breached yesterday's low (orange line) but the two breakout candles did not get confirmed and market created a kind of wedge pattern. The 1 p.m. hourly candle respected (closed at) the weekly S2.

During the new trading hour (2 p.m.) market got pushed down by the decreasing 10 SMA and breached only temporarily the weekly S2 to bounce back at the daily S1 to trigger the wedge pattern breakout to the upside (5). The up move found resistance in the price zone of the small consolidation, the 200 SMA and particularly the red line (6).

False/ True Breakout

True or False Breakout Trendline Break


Breakout Candle Confirmation


chart analysis forex euro us dollar
Weekly Support/ Resistance Forex Trading

Trendline Analysis


On the weekly chart we see that we breached the weekly low at 1.2588 in 2010 and the January low 2012. The recent trendline (green) could not hold the market after the trendline got respected last week. 

In general a trendline is stronger when the test of  it is not so early after the trendine got created. In this case the trend line came into existence due to the January low 2012 combined with the low in 2010 and the trendline got already tested in May 2012 (much to early to give strong support). EUR/USD is now clearing the stops below these lows.

Head and Shoulder target
Daily Head and Shoulder target


On the daily chart we see that market reached the classical Head and Shoulders targetat about 1.2554. Furthermore this price zone is likely to provide some support due to the 161% fib extension from C-D at E, the 61.80 % fib extension from E-F at G. The clearing of the stops under the recent lows is a typical target of price movement and can give some support - manipulative stop clearing accomplished.


trendline break signal
1 hour Trendline Break Signal

Breakout Trading 


The Difference between true and false breakouts


We had a similar consolidation (blue circle) like yesterday)(green circle). Both 3 wave consolidations had a lower point B and higher point C, which often precedes a strong trend continuation. Point B slightly breached the recent lows (blue and pink line) and the weekly S1, monthly S3 but the hourly candle closed at the monthly S3.

So the first breakout lower failed (5 min chart) and market moved up to point C slightly above point A. This false breakout caught many breakout traders to early who had there limit orders below the low of yesterdays strong daily downward candle.

However, market did not confirm the first breakout and turned around at the recent lows + the weekly S1, monthly S3 after the slight breach at 9 a.m. GMT and closed above the recent high (point A) to trigger some of their stops (point C). At point C market finished the 3 wave consolidation at the resistance of the 20 SMA (purple line) and went down for the second true breakout.

In the Asian session at 1 a.m. GMT the monthly S3 got already touched (weaken), which increased the chance of at least a breach of this level.

The 2 p.m. hourly candle respected (closed at) the monthly S3 just before the true breakout occurred (Breakout Timing). The  decreasing 10 and 20 SMA (red and purple line) also provided resistance and pushed price down.
 

True/ False Breakout Confirmation
5 min True/ False Breakout Confirmation

On the 5 min chart we see that the breakout candle 1 at 9.10 a.m. occurred just after the prior 5 min candle touched the low from 18th of May (blue line). However, this breakout (blue line) did not get confirmed and market also did not accomplish to close below January's low (pink line) so that market reversed and triggered some stops of the breakout traders by creating the new high.

However, the false breakout weaken  the the confluence support level of the monthly S3, weekly S1, daily S1 and the lows of the 18th of May and January due to the breaching so that the second breakout had a high chance to break this support level.


Trendline break

Trendline Break Confirmation


Understanding price Breakouts


chart analysis 10 sma
Daily 10 Moving Average SMA

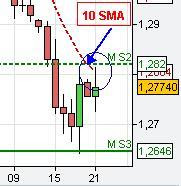
On the daily chart (left) we see that EUR/USD found resistance at the 10 SMA and monthly S2 so that in the following price dropped down.


technical chart analysis forex euro
1 hour Technical Chart Analysis Forex


SMA Trading


On the hourly chart analysis above we see that the 200 SMA also provided resistance in the same area like the daily 10 SMA. EUR/USD only made a slightly higher high yesterday at about 1.2825 (stop fishing) whereby the 5 min  breakout candle at 8.50 p.m. did not get confirmed due to the missing close of the succeeding 5 min candles above the high of the breakout candle (not shown).

EUR/USD dropped down from this high (point A) and found temporary support at the 20 SMA (purple line) and the prior consolidation price zone at point B. In the European session market broke through the 20 SMA and touched/ respected the red trendline with the 9 a.m..hourly candle (red circle). With the beginning of the next hourly candle (10 a.m.) market immediately broke through the now weaker (after the hourly touch-Timing) trendline-support at 10 a.m. after the small consolidation (see 5 min chart analysis) finished with the start of the new hourly candle (10 a.m.).

In the following, EUR/USD formed  a 3-wave consolidation (green circle on hourly chart analysis) at the 20 SMA on the 4-hour chart (not shown), daily S1 and the 161% fib extension from A-B at C (hourly) at about 1.2739 and the 61.80 % fib extension from A-B at C (5 min chart analysis) before price broke through it with the developing of the new 4 hour candle at 4.p.m (not shown). EUR/USD went down to the next support level at the 61 % fib retracement at 1.2712 and the 100 % fib extension from C-D at E (hourly chart analysis) where price currently consolidates.


technical chart analysis forex euro
5 min technical chart analysis forex euro


 3-wave consolidation


On the 5 min chart analysis above we see that the recent 3-wave consolidation (DEF) (green circle on the hourly) formed a lower low (E) and  a higher high (F) in the consolidation. This kind of consolidation pattern is very often followed by a strong wave in the trend direction (down) as many breakout-traders got trapped (E, F) in the wrong direction, which often fuels the momentum. The small bear flag on the right of the 5 min chart analysis was the respecting of the green trendline in particular and the consolidation (circled) between 2 p.m. and 3 p.m. before price resumes the downward trend.
The breakout candle 1 at 1 p.m.breached again the weekly pivot point but  the breakout did not get confirmed on the 5 min chart (point D)


Update: The recent downward move started at 8 p.m. after the 61.80 % fib retracement at 1.2712 was respected by the 4-hour candle opening at 4 p.m.. With the beginning of the new 4-hour candle (opening at 8 p.m.) the underlying support zone got weaker (61.80 % fib retracement got already touched) and price broke through it after a nice 3-wave consolidation on the 5 min chart between 7 p.m. and 8 p.m. just before the 8 p.m. 4-hour candle opened..


Trendline break on the 16th of October


EUR/USD confirmed the break of the hourly trendline


The Euro confirmed the break of the hourly resistance at 1.2991 (blue line) and the daily R1 with the beginning of the new hourly/ 4-hour candle at 8 a.m. (Timing Setup). The 100 % Fibonacci extension from the recent swing up (11 - 12th of October) moved to the daily low of October 15th (Yesterday) provided resistance so far at around 1.3057.

The 1 hour Euro Chart analysis below also shows a Butterfly sell pattern, important Fibonacci support and Fibonacci resistance at the 61.80 % and 100 % level.


butterfly pattern, 100 % fibonacci extension
1 hour Trendline break confirmation

Price Rejection

Market Price Rejection


20 sma chart analysis
4 hour 20 SMA
10 sma chart analysis
Daily
10 sma chart analysis
Daily 6 p.m.


Understanding price pattern 


Breakout trading


On the daily chart at 6 p.m. GMT we see that EUR/USD found resistance at the daily 10 SMA at about 1.2805 and pulled back from there to find some support at the 20 SMA (4 hour chart-purple line) and yesterdays consolidation price zone (1 hour chart below).


Furthermore, this price level got also supported from the 100 % fib extension from A-B at C at about 1.2733 (1 hour chart below). The price bounced back  strongly from the confluence support level and created a strong bullish candle (long price wick-4 hour chart-left), which closed right at the weekly pivot point at about 1.2768. Initially, after the 4 hour candle closed at 4 p.m. GMT (resistance level-weekly pivot-got touched/respected-Timing) EUR/USD went up for one candle (Breakout candle 2 on 5 min chart -last chart).


However, the Euro came back due to the resistance of the 20 SMA (purple line and prior consolidation zone on the 1 hour chart (4 p.m.-the doji) + 200 SMA on 5 min chart. From 4 p.m. to 5 p.m. GMT EUR/USD consolidated around the weekly pivot point (5 min chart) before price moved up again at 5 p.m. GMT (Breakout candle 3 at 5 min chart) just after the prior 1 hour candle (starting at 4 p.m. GMT-doji) closed and respected the resistance level, particularly the 20 SMA on the hourly chart at about 1.2775. The 5 min chart also shows that market got supported due to the rising 20 SMA (last chart).


Finally, EUR/USD is closing right at the 10 SMA and monthly S2 resistance (respect the resistance zone).


200 sma chart analysis
1 hour chart
true and false breakout chart analysis
5 min chart


Fibonacci Extensions


If we focus on the price development on the 5 min chart today from 1 p.m. and 6 p.m. we see that EUR/USD bounced back from the support level in a kind of V-shape pattern at 2.20 p.m. GMT.
In general, if a trend prevails then market often moves strongly in one direction then consolidates before market resumes the trend direction. Typical targets of the continuation are the 61.80 % (weak), 100 % (normal) and 161 % (strong) fib extensions.


The initial target is often the 61.80 % target  where market is likely to react. In a strong trend market could easily ignore the 61.80 % level or only  react  on a shorter time frame and proceed directly to the 100 % fib extension which often provides solid support/ resistance, at least for a while. Very often price consolidates (smaller consolidation pattern than the prior consolidation) (bear/bull flag) at the 61.80 % fib extension before resumption.


However, if price is not at least consolidating at the 61.80 fib extension level and is instead bouncing back strongly into the prior consolidation (V-shape) then the underlying trend is in question (turn around or larger consolidation pattern). The last breakout is a false one/ shake out) to trigger stops and fool breakout trader, particularly at strong support/resistance levels, which only temporarily gets breached/ penetrated without confirmation.


 V-shape turn around


On the 5 min chart, we have a small example of this kind of price rejection. If we focus on the small bear flag on the left of the 5 min chart after market dropped from the prior consolidation at point a then it is observable that the last downward candles only reach the 61.80 % fib extension from a-b at c and that price does not consolidate there but instead turns around and moves back into the consolidation pattern. Furthermore, no succeeding candle closes below the range of the breakout candle 1 (no confirmation).
This kind of price behaviour ( V-shape turn around at the 61.80 % fib extension and/or non confirmation of the breakout candle is often observable before market either turns around or at least is starting a larger consolidation pattern.

We had another example of the V-shape turn around at a 61.80 % fib extension on the 18th of May (recent turn around) at the strong confluence support zone at about 1.2642 due to the 61.80 fib extension from the recent swing down + the weekly S3 (). Furthermore, the chance of a turn around of price at the support level got also increased due to the lower downward momentum of the second swing into support compared to the first swing down.

False and True Breakout Patterns

Euro Dollar Breakout


False and True Breakout Patterns


On the weekly time frame we see that EUR/USD closed right at the weekly trend line (respected it). However, it is unclear how strong the support from the weekly trend line (low from June 2010 and January 2012) will be during the next weeks.

trendline chart analysis
Weekly Support Resistance trading


Timing of the Breakout


On the 4 hour chart EUR/USD strongly bounced back from the support zone at 1.2641 and in the following EUR/USD moved up to each resistance level (), touched it (respected it) and broke each resistance level in the beginning of the succeeding 4-hour candle (Timing) (see also 5 min chart below).

Finally, EUR/USD moved up to the weekly trend line (orange line) and found resistance there, also due to the 61.80 % fib retracement of the recent swing down at about 1.2783, daily R2 and the 100 % fib extension from the recent swing up from 1.2641 to b at c at about 1.2790 (see 5 min chart).


V shape turn around Trading pattern
4 hour chart V shape turn around Trading pattern


Breakout candle


On the 5 min chart, we see that all three breakout candles occurred in the beginning of the succeeding 4 hour candle (12, 4 p.m. 8 p.m. Timing) after each prior 4 hour candle touched the resistance level. The breakout of the breakout candle 2 did not get confirmed on the 5 min chart so that in the following price moved back in the consolidation. Another nice three wave consolidation took place before the next breakout occurred. Finally, EUR/USD closed around the weekly trend line.


false and true breakout chart analysis
5 min false and true breakout chart analysis


Typical Consolidation Pattern

Consolidation Analysis


Consolidation patterns with three waves/ swings


euro us dollar chart analysis
1 hour  euro us dollar chart analysis


Bull Flag and  Triangle Consolidation Pattern


Yesterday at 12 a.m. GMT, EUR/USD broke through the triangle bottom but did not confirm the breakout of the low and reversed.

The EURO found resistance in the middle of the price zone of the triangle consolidation pattern (red circle above) and the price zone of the tight consolidation. Market price went down again till today at 7 a.m. GMT.

Market bounced from the strong support zone at about 1.2641. From there, the Euro went up to the Pivot point, consolidated there (Bull flag) and broke through.

Today's price action might be seen as an inverted Head and Shoulders pattern where the brown neckline got broken in the European session. Recently a second bull flag was formed and market broke out to the upside.


typical consolidation pattern
5 min Typical Consolidation Pattern

Typical Consolidations


On the 5 min chart, we see that the two consolidation pattern formed the typical three waves/ swings consolidation pattern formation before the uptrend continued.

The EUR/USD found resistance at the 100 % fib extension from today's up move from the support level at 1.2641 to the neckline moved to point a at 1.2736, the 61.80 % fib extension (a-b at c) at 1.2736, daily R1 and the 127 % butterfly target (127 % from b-c at c). This confluence resistance zone hold the market (red circle)  and market went down to find some support at the middle of the price level of the prior consolidation pattern at 1.2710.


Timing in Breakout Trading


It is important to recognize when the breakout of the consolidation pattern occurred (Breakout candle 1,2).

Both price breakouts occurred at the beginning of a new 4-hour candle (12 a.m., 4 p.m. GMT). If you
euro us dollar chart analysis
4 hour Breakout Timing
observe the 4 hour chart then you also see that the 10 SMA and the 20 SMA provided resistance.

The EUR/USD respected these level but with the beginning of the new 4 hour candle (12 a.m. and 4 p.m. GMT) these resistance zones got weaker (already touched) and market broke through it right at the beginning of both new 4 hour candles (Breakout Timing).

The second breakout (4.10 p.m. GMT) did not get confirmed as the succeeding  5 min candles did not close above the range of the breakout candle (no confirmation on the 5 min chart after the breakout of the consolidation - green line).


Fibonacci trading levels

Trend and Swing Analysis


Fibonacci Extension targets


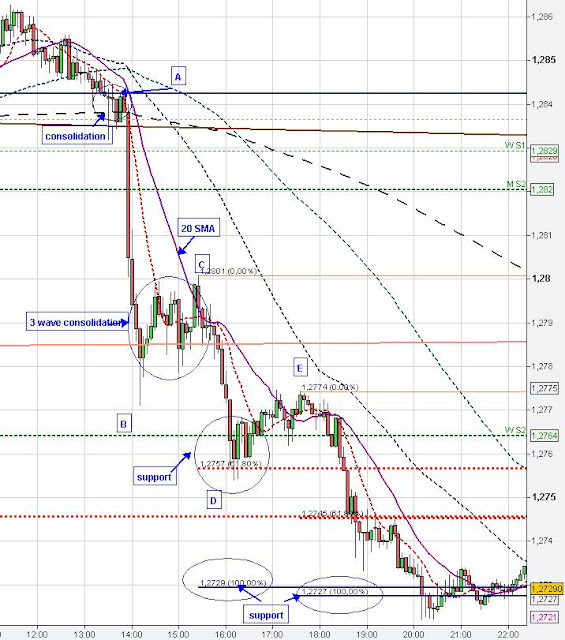
After the wave down (A-B) yesterday in the European Session market consolidated (typical 3 swings) and market found resistance at the decreasing 20 SMA and the 1.28 round number. Market dropped down (C-D) and found some support at the Weekly S2 and the 61.80 % Fibonacci extension from the start of the sudden drop in price from A to B at C at about 1.2757.

The 61.80 % Fibonacci Extension is very often only intermediate support/ resistance in a strong trend where price sometimes reacts/ consolidates before the market goes further to the 100 % Fibonacci extension.

Market dropped down again and reached the 100 % Fibonacci extension (A-B at C) and the 100 % Fibonacci extension from C-D at E at about 1.2729. Market consolidated at the support level before dropping down again in the Asian/ European Session today.

fibonacci study, trend, swing analysis
5 min Fibonacci Trend Analysis


Second Test of Support

Consolidation at Support


Trading Support and Resistance


eur/usd chart analysis
5 min EUR/USD Technical Chart Analysis

The support zone at 1.2825 (analysed in ) which held the market in the yesterday and in the Asian session (got tested) could not hold a second test and got broken recently.


Inverted Head and Shoulder


On the 5 min chart above, we might interpret the price action in the Asian session today as an inverted Head & Shoulder. The neckline got broken and the market went up to 1.2869.

The circled consolidation on the right of the chart took place at the support level created by the green trend line, the inverted H&S neckline, the 61.80 % fib retracement of the recent swing up and the 100 % fib extension from wave A-B moved to point C at about 1.2840. The market consolidated there (typical three swings) and in the following market could not hold support so that price broke down strongly (probably due to news...).

Market currently seems to find some support at the weekly trend line from the June 2010 low and January 2012 low  .

Daily Head and Shoulder pattern

EURUSD Technical Chart Analysis 


Head and Shoulder Analyzed


Head and shoulder pattern
Daily Head and shoulder pattern


The daily Head and Shoulder pattern got triggered due to the gap down last week. On Monday, May 7, we had a nice retest of the neckline, which acted as resistance and led to a sharp price drop. The market took out the low of January 23 (stop fishing) and so far respected the support zone (analysed in 


Neckline break 


Below the market is the weekly trend line (low of June 2010 and January 2012) which could act as support. The classical target of the Head and Shoulder is the length of the head (A-B) projected from the neckline break (1.3061) at about 1.2551, which would also clear out the striking low from January at 1.2624.
However, it is to early to make  these assumptions and further price action will give hints of what to expect.

Flag patterns

Bull and Bear Flags


Trading the Flag patterns


eur/usd techncial chart analysis
Daily Euro US Dollar Forex Market Update
At the daily chart we had a small consolidation last week (circled) at the 1.2931 support level created by the daily low from January 25 and the gap from January 23.

eur/usd techncial chart analysis
4 hour Euro US Dollar Forex Market Updates
Oh the 4 hour chart we see that the daily support and the 61.80 % fib extension from the A-B wave moved to the C wave at 1.2928 held the market last week (no confirmed break of the the support). However, price also could not bounce back so that the bear flag got triggered due to this weeks gap down. In the following, price held at the 61.80 % fib extension from wave C-D moved to point E at 1.2884 in the Asian session today.

Bear flag trading pattern
1 hour Bear flag trading pattern


As seen on the 1 hour chart, the 100 % fib extension of wave a-b moved to point c at about 1.2882 strengthened this support area. Market consolidated there but could not bounce back so that  the following bear flag was created, and price broke down in the European session to the 1.2825 support level created by Weekly S1, Monthly S2 + the 100 % fib extension at point a (or point E on 4 hour chart) at 1.2825 and the most recent fib extension of wave c-d moved to point e at 1.2819. Market seems now to consolidate at this support level.


Note:

Bear/Bull flags show that the market is unable to bounce back from the support/ resistance level and erode these levels over time till the market stops consolidating and continues the trend (level can not be held any more after accumulation/ distribution is over).

In a strong trend the bull/ bear flags can repeat over and over till a rejection of the breakout occurs (price moves back into the consolidation) or the the bull/ bear flag fails (breakout of the consolidation is to the other side. Then, a turn around or larger consolidation could follow


Support/ Resistance Confluence

Consolidation pattern, Fibonacci and SMA


S/R Confluence levels/ Zones


Support/ Resistance Confluence zones


eur usd chart analysis
5 min Support/ Resistance Confluence zones
ending diagonal
1 min S/R Confluence levels


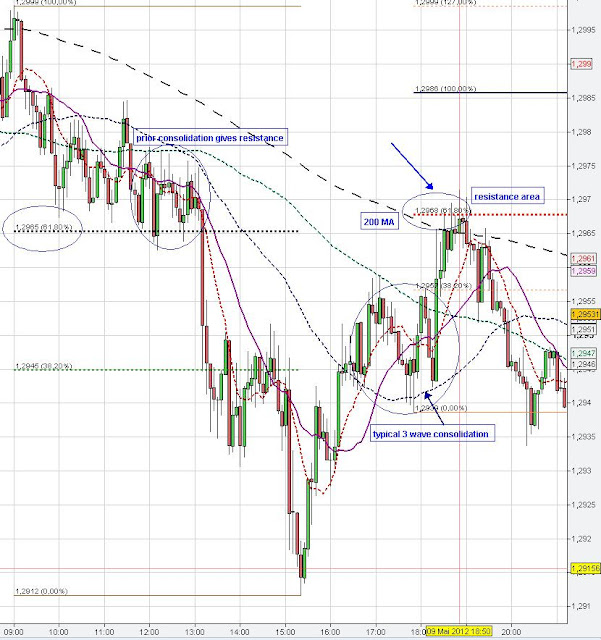
In the US trading session we had a strong Confluence resistance zone on the 5 min EUR/USD chart at about 1.2965 due to 61.80 % fib retracement of prior swing down, 61.80 % fib extension, 200 MA as well as the prior price zone of the consolidation pattern from the day before.

The Understanding of Consolidation pattern is important as these price zones often act as support/ resistance when market approaches these price levels again for the first time.


A further resistance level was the 20 MA on the 1h chart (not shown).

On the 1 min chart we got further confirmation due to the ending diagonal pattern of wave C (up move lost strength as it approached the resistance area + 61.80 % fib extension.)

In general the first step is to find strong Confluence resistance/ support zones and the second to observe price behaviour at these S/R Confluence levels for confirmation.


Fibonacci Confluenc S/R zones


eur/usd chart analysis
5 min Support Resistance S/R Confluence Analysis


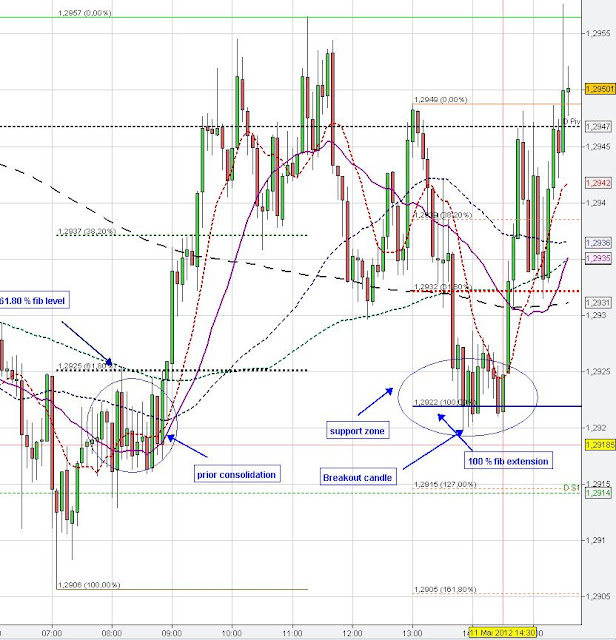
At the open of the US trading session, market bounced from the 1.2920 S/R Confluence support level due to the 61.80 % fib retracement + 100 % fib extension and prior consolidation at the same confluence level.

Furthermore, the 61.80 % fib retracement of the recent swing up didn't  break substantially because there was no lower close of the succeeding candles below the range of the red breakout candle (no confirmation).


Back to top