Risk Disclaimer

Risk Disclaimer: Trading is risky! Never trade money you can not afford to lose! Site content is only personal opinion and never a Trade Recommendation!

Changing Role of Support to Resistance

Support and Resistance Trading


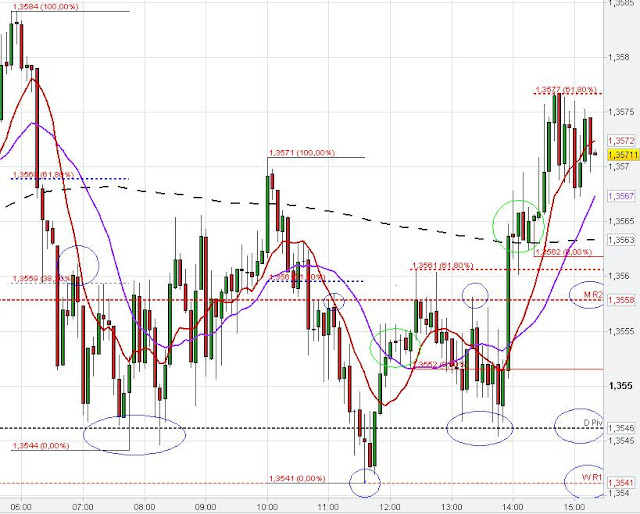
The Euro USD very often respected the different daily and weekly Pivot Points as support and resistance on the 5 min Intraday Chart. The daily Pivot Point held the sharp intraday downtrend after the Nonfarm payroll release today and the Euro USD reversed sharply up for new highs in the trading session. 61.80 % and 100 % Fibonacci extension levels also helped to determine intraday support and resistance zones.

The Euro moved only shortly into the 1.37 vicinity before retracing back. The daily R1, daily R2 and the weekly R2 beautifully show the changing role from resistance to support. The daily R1 was resistance at 7 a.m. GMT and after resistance got broken the resistance became support between 10 a.m. and 2 p.m.. Similarly, the daily R2 and the weekly R2 acted as resistance before the role changed depending on the vicinity of price action.  The chart formation at around 10 a.m. GMT might be seen as a small Head and Shoulder pattern at the daily R2 resistance.


changing role from resistance to support
5 min Changing role resistance to support


The below EUR/USD Chart shows how the monthly R2 Pivot point changed its role from resistance  (at 11 a.m.) to support after market broke this resistance level and confirmed the breakout at about 3 p.m..

Euro USD Pivot Points, S/R
5 min Resistance becomes support

Market Range Trade Setups

Trading a Sideways Market


Trading in a Range


Euro US Dollar market is in a sideways trading range.
Market is waiting for the Nonfarm Payroll Release on Friday, 01.02.2013.

The Euro US Dollar stayed in a sideways range and sideways market on the hourly time frame till now.

The daily Pivot Point and the weekly R1 Pivot held the market today. Fibonacci analysis and Pivot Points provided some possible trading setups in the sideways market to trade the market range in the EURUSD (see chart below).


Fibonacci studies and Pivot Points
5 min Fibonacci Setups and Pivot Point anaylsis


Another Example for a sideways trading range bound market


The Euro Dollar traded in the hourly consolidation range around the low of November 8th (see EURUSD Chart below).

The European session started with a Stop Run at 6 a.m. GMT. This false breakout on the 5 min Euro chart led to a price reversal of the EUR/USD. Market moved down to the 1.27 level in an impulsive move. However, market price action was capped in the range of this impulsive move during today's trading session.

At 1.10 p.m., the Euro Dollar reversed at the 1.2735 confluence resistance level because of the Fibonacci cluster due to the two 100 % fib extensions from the previous swings up, the daily pivot point and also the penetration of the recent high at 1.2730 on the 5 min chart (Stop Runs above recent high and the daily Pivot). The confluence resistance would have provided a good Trading Setup for a short entry in the market.


We had many continuation patterns (green circles-Pennants, Flags, Ledges), which could have guided today's trading setup decisions. Furthermore, the red circles show where the Breakout Timing strategy could have been applied and the orange arrows show where the Support/ Resistance through the consolidation price zones led to a market reaction. The Fibonacci trading levels also helped to find trading setups in regards of market turning points.


Trading Signals,Support,Resistance
5 min Trading Setups Euro Dollar

Back to top