Risk Disclaimer

Risk Disclaimer: Trading is risky! Never trade money you can not afford to lose! Site content is only personal opinion and never a Trade Recommendation!

Candlestick Patterns Hammer

Price Reversal


Hammer Candlestick


Candlestick patterns hammer
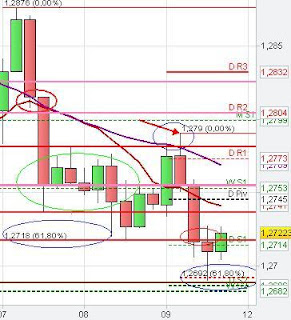
1 hour Candlestick Patterns Hammer, Price Reversal

Candlestick Chart pattern


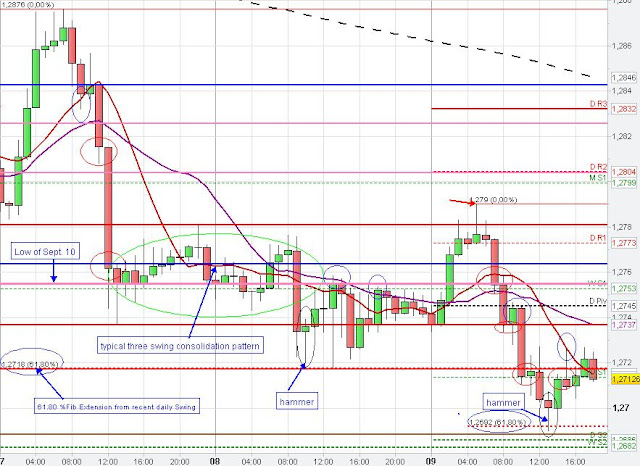
The Euro had a relatively quite session again today. Market price broke out of yesterday's consolidation pattern with the beginning of the new daily candle (Breakout trading) and the Euro made a new daily low but market hold at the daily S2 support.

At 10 a.m. the Euro created a hammer candlestick pattern and EUR/USD market price started to move upwards.

The three consecutive lows from 4 a.m. to 10 a.m. might be seen as a Three Drives pattern. Interestingly, the Euro always closed above the daily S2. The three consecutive lows tempered many breakout traders to go short following the breakout of yesterday's consolidation pattern.

These false breakouts caught many traders in the wrong position which often leads to a price reversal. The hammer pattern (Price rejection) initiated this price reversal and the EUR/USD moved back into yesterday's consolidation pattern. Yesterday's consolidation price zones acted as resistance as price approached this level again and the Euro reversed back down.

The 5 min EUR/USD chart shows some Fibonacci levels which could helped the trader to find entry and exit points. The red arrows show some false breakouts, which occurred today.

The 5 min chart also shows that we did not have a confirmed breakout through the daily S2. See Unconfirmed Breakout Candle


5 min EUR/USD Chart Pattern

Flag patterns, Pennants, Ledges

Continuation Trading Chart Patterns


Trading Flag patterns, Pennants and Ledges


EUR/USD


Technical Chart Analysis EURUSD
4 hour  Chart Pattern/ Analysis
 continued its downtrend today in the beginning of the European trading session with the triggering of the Head and Shoulders pattern on the 5 min chart, which occurred at the daily R1 and the 20 SMA on the 4 hour chart after clearing the stops above the consolidation high.

On the 5 min chart we see many Continuation chart patterns (Flag patterns, Pennants, Ledges - see green circles), which got triggered and market resumed its downward trend. Very often the EUR/USD made attempts to renew its downtrend with the beginning of the new trading hour for a true or false break of support, frequently after closing at support level  e.g. 8 a.m., 9 a.m. 11 a.m. 1 p.m. and vise versa for the uptrend at 3 p.m. and 5 p.m. (see red circles on hourly chart - Breakout Timing).
The Consolidation pattern between 11 a.m. and 12:20 p.m. GMT can be seen as a bear flag of the recent impulsive downward move from 10 a.m. to 11 a.m. (5 min chart).

The daily Pivot point changed its role from support to resistance after the break of this level 8:45 a.m. (see 5 min chart).

The Euro found some support at the Fibonacci Cluster at around 1.2692, the 61.80 % Fibonacci Extension of the recent 4-hour swing down and the 100 % Fibonacci Extension level on the 5 min chart. From there, market leveled off.

Technical Chart Analysis Euro
1 hour Continuation Chart Patterns Analysis

Technical Chart Analysis EURUSD
5 min Continuation Chart Patterns (Flag patterns, Pennants, Ledges)

 
Back to top