Consolidation Price Zones
Consolidation Patterns with three Swings
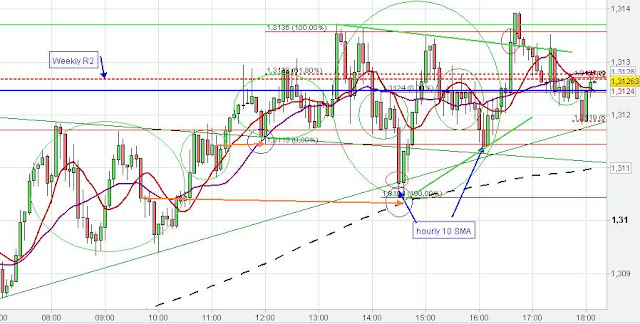
IF you observe the consolidation patterns (green circle) then you will recognize that most of them consists of three waves/ swings (Typical consolidation pattern) before the consolidation terminates and price renews its prevailing trend. Very often these consolidation price zones also provide some support/ resistance when price captures this price zone again for the first time (orange arrow). More information about Consolidation patterns and Consolidation price zones are at: Support and Resistance Chart Patterns
 |
| 5 min Typical Consolidation Pattern |
Three swing Consolidation formation
The Chart pattern analysis below again shows the typical three swing/ wave consolidation patterns (The two large ellipses illustrate the typical three swing consolidation formations), followed by the breakout of price in trend direction after the termination of this consolidation formation type.

Consolidation price zones in the EURUSD
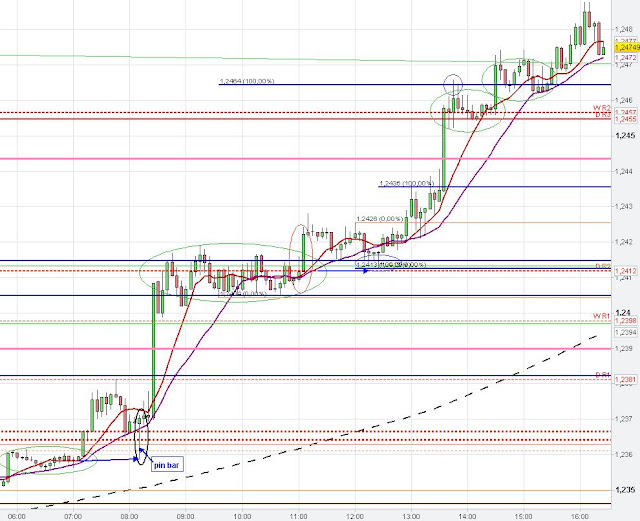
On the 5 min chart of the EUR/USD below we see the formation of the pin bar candlestick pattern at the price zone of the recent consolidation pattern.The Euro moved up strongly and price momentum recedes during the formation of the larger consolidation pattern at the daily R2 Pivot (green ellipse). The price breakout of the larger consolidation (red ellipse) occurred at the beginning of the new hourly candle (11 a.m.) (Breakout timing).
However, the price breakout was very shallow and market retested the consolidation price zone (blue arrow) before the Euro started to moved up further to the next smaller consolidation pattern at the daily R3 Pivot, the weekly R2 Pivot and the 100 % Fibonacci Extension level.
 |
| 5 min Euro Analysis, Pin bar, Consolidation pattern |
Typical three swingconsolidation/ continuation pattern on the 5 min chart
Potential Inverted Head and Shoulders pattern
The Euro moved lower and created a typical three swing consolidation pattern around the 100 % Fibonacci Extension level. Price broke out of the three swing Consolidation pattern at the beginning of the new hourly and 4-hourly candle (red ellipse), which is often an important Breakout Timing (GMT).
The EUR/USD found support at the 61 % Fibonacci Extension of the recent swing down moved to the high of the consolidation pattern. Market formed a kind of inverse Head and Shoulders pattern, which might led to the price reversal of the EUR/USD to the upside
 |
| 5 min Inverted Head and Shoulders pattern |

