Fibonacci extension levels
Flag patterns
The EUR/USD Chart Analysis
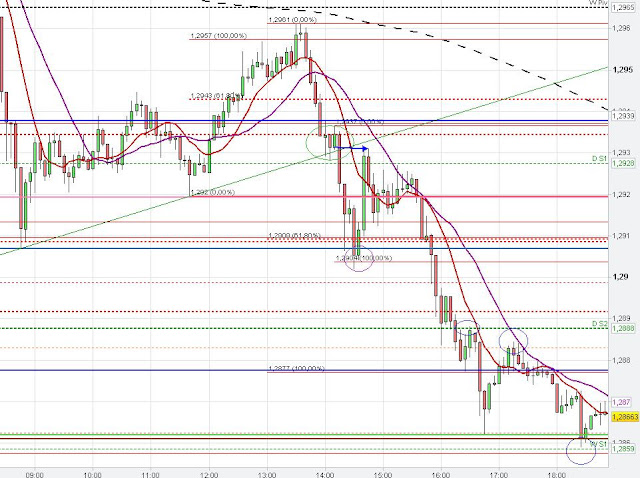
shows the importance of the 61.80 % and 100 % Fibonacci extension levels, which market often respects as support/ resistance, at least temporarily. On the hourly Euro Chart we see that market respected the 61.80 % Fibonacci Extension level at 8 a.m..Market retraced up from this Fibonacci Extension level to the downward sloping 20 SMA (purple line) and the 61.80 % Fibonacci retracement level. From this resistance level, which market approached at 1 p.m., the EUR/USD rolled over and continued its downward trend to the 100 % Fibonacci Extension level. The 61.80 % Fibonacci Extension level often provides only temporary support/ resistance. The 100 % Fibonacci Extension support level got further strengthened due to the weekly S1 at 1.2859.
 |
| 1 hour Fibonacci extension levels |
On the 5 min Chart we see that the EUR/USD consolidated at the uprising trend line and the daily S1, formed a bear flag (Continuation pattern) and market finally broke through the support level of the uprising trend line. Market took out the stops and triggered the limit breakout orders below the recent low (left side of the 5 min chart) and the Euro started to retrace back into the Consolidation zone (Market Price Manipulation) of the prior bear flag, which now acts as resistance (Consolidation price zones). Furthermore, the daily S1 changed its role from support to resistance after the confirmed break of this level on the 5 min chart.
 |
| 5 min EUR/USD Chart Analysis |
Another EUR/USD Chart Analysis in regards of Fibonacci Extension levels and Bear flag pattern:
 |
| 4 hour Fibonacci Extension |
Fibonacci and Bear Flag
continued its down trend today with the triggering of the bear flag pattern. The 10 SMA on the 4 hour chart provided resistance to the Euro and the EURUSD depreciated further. The Euro found support at the daily S1 and 61.80 % Fibonacci extension (1 hour chart) and market turned around after the creation of the hammer candlestick pattern on the 5 min chart. The EUR/USD moved up to the prior consolidation price zone (bear flag - hourly chart-orange arrow), which acted as resistance. |
| 1 hour Bear Flag pattern, Hammer |
 |
| 5 min Hammer pattern |
