Risk Disclaimer

Risk Disclaimer: Trading is risky! Never trade money you can not afford to lose! Site content is only personal opinion and never a Trade Recommendation!

Market Gap Trading

Market Gaps Analyzed


Closing the Market Gap


 Day Trading Setups

1 hour Gap Trading 


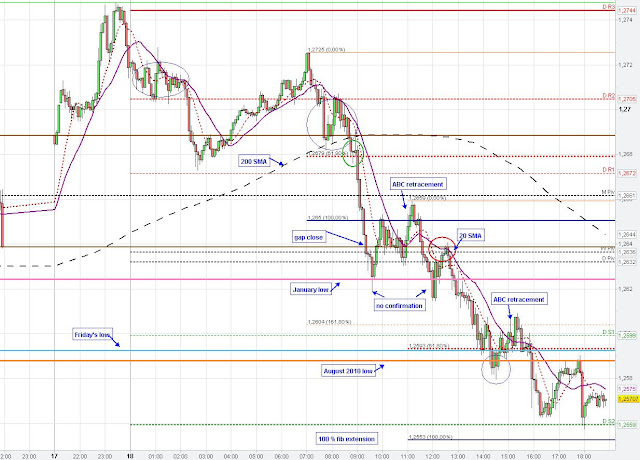
The Euro gaped up to 1.2748 and from there EUR/USD started to move down and completely retraced/ closed the market gap and the market even fell much further.

The 2 a.m hourly candle found support at the 10 SMA (red line) and the Euro started to retrace up to 1.2725 supported by the rising hourly 10 SMA. After the end of the upward retracement the Euro resumed its downtrend and closed today's gap.

The 8 a.m. hourly candle respected (touched) the hourly 20 SMA (purple line) after the Euro consolidated between the 20 SMA and 200 SMA on the 5 min chart, and the Euro initially broke through the 20 SMA with the beginning of the new hourly candle at 9 a.m. (London open- green circle on 5 min chart).

The Euro found some temporary support at the pink line (low of January) and formed an abc-retracement up to the monthly pivot point. From there, the Euro bounced back and penetrated the pink line again but market could not confirm the breakout on the 5 min chart.
 Day Trading Setups

5 min  Daily Gap Trading Setups


Changing role of Support and Resistance

Important levels and Patterns for Trading


Key Support/ Resistance


On the 4 hour and 1 hour chart we see that the Euro very often closed at (traded/ consolidated around) the low of January 2012 at 1.2624 key level, pink line), which coincides with the daily high of the 7th of June and the gap opening on Monday. Particularly on the 4 hour chart we see that every candle today closed at this important chart level.

euro chart analysis
4 hour Changing role from resistance to support

Daily Pivot Point S/R
1 hour Daily Pivot Point S/R

Head and Shoulders neckline


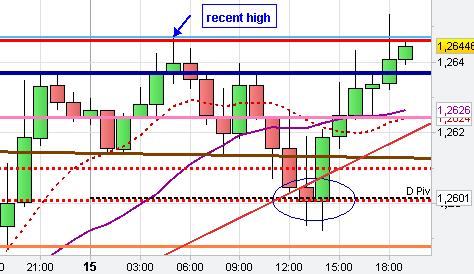
On the hourly chart we see that the Euro respected the 61.80 % fib extension at 5 a.m. (recent high) and price moved lower from there. On the 1 hour and 5 min chart (below) we see a nice Head and Shoulders pattern. At 11:15 a.m. the Euro breached the neckline (brown line) (A) but market could not confirm this breakout (first test).

The second break of the neckline occurred at 12:45 p.m. and market moved to the 100 % fib extension (B). EUR/USD breached the daily pivot point - key level-, however, the pivot point, the 4-hour 10 SMA and trend line (4-hour chart) supported the market. The Euro managed to close above the neckline on the hourly chart at 2 p.m. after a choppy price action between the neckline and the weekly pivot.

On the 5 min chart (below) we again see the importance of the pink line and its changing role from resistance to support vice versa -key Support/ resistance chart level. The Euro formed a bull flag on the 5 min chart and in the following closed above the pink line after market already regained the neckline with the hourly close at 2 p.m.. The Euro bounced back from the pink line at 5:25 p.m. (now support) and cleared the stops above the recent high (C). However, market could not close above the recent high on the 5 min chart at the first breakout (only stop fishing) and the Euro fell back again.

euro chart analysis  bull flag
5 min Important Tradind Chart levels and Patterns
Back to top