Fibonacci Trading
Fibonacci retracement and extension levels
 |
1 hour Fibonacci Trading |
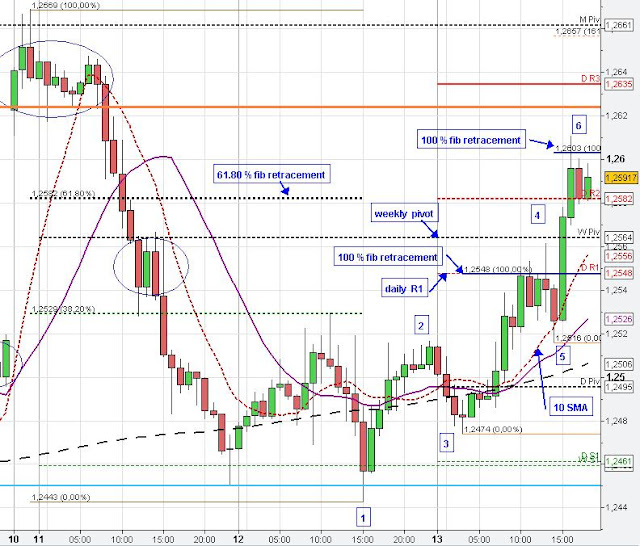
Today in the beginning of the European session the Euro moved up to the 100 % fib extension (1-2 at 3) and daily R1 at 1.2548. The Euro struggled with this resistance level although EUR/USD moved up close to the weekly pivot point (1:35 p.m. GMT, 4). However, EUR/USD failed to close above this resistance zone (1.2548) on the hourly basis so that market moved lower (1:35 p.m.) to find some support at the rising hourly 10 SMA (red line-5). From there, the Euro strongly moved up above the prior resistance zone at 1.2548 (second test) and market was able to close above the weekly pivot on the hourly (second test) and 4-hourly basis (candle close at 4 p.m.). The hourly candle (3-4 p.m.) approximately closed at (respected) the 61.80 % retracement and daily R2, which in the following got broken with the beginning of the next hourly candle (4-5 p.m.) and the Euro moved up to the 100 % fib extension at 1.2603 (6).
 |
| 5 min Butterfly sell pattern |
Fibonacci Retracement at 61.80 %
On the 5 min chart we see that the Euro very often reacted at the 61.80 % fib retracement marked with the 0 on the 5 min chart and also at the 100 % fib extension market with the 1 on the 5 min chart (important Fibonacci levels). At the beginning of the London trading session at 9 a.m. the Euro made a abc retracement before market moved up to the 100 % fib extension at 1.2554. In the following market formed a typical 3-wave consolidation pattern/ butterfly (circled). After the termination of the consolidation the Euro reached the typical butterfly target (127 % fib extension-1-0 at 0) before EUR/USD reversed and took out the low of the prior consolidation (1.2526), which is also typical for a butterfly pattern. The Euro found support at the 10 SMA on the hourly Chart (2-3 p.m.) and formed a kind of ending diagonal on the 5 min chart (ED). In the following, the Euro strongly moved up to the 100 % fib extension, where market consolidated.

