Risk Disclaimer

Risk Disclaimer: Trading is risky! Never trade money you can not afford to lose! Site content is only personal opinion and never a Trade Recommendation!

Rejection Candle Chart Patterns - Hammer

Candlestick Chart Analysis


Hammer Rejection Candle


The Euro moved upwards against the US Dollar after the rejection candle/ hammer candlestick pattern on the 13th of November. There are important Support/ Resistance levels on the daily EURO US Dollar chart. Market currently trades at the daily confluence resistance level consisting of the 20 SMA and further the monthly S1 and the low of October 1st, which both held the market on the 15th of November at around 1.28 (First test). 

During the start of the US session today, market penetrated the 1.28 resistance level (second test) and moved up to the weekly R1. On the 5 min chart we see that market closed at the 1.28 resistance level with a bullish candle at 3:40 p.m. GMT just before  the Euro breached this level (Breakout Timing). The following breakout candle at 3:45 p.m. got high bullish momentum because of the stops placed above the 1.28 level. However, there was no follow through or breakout confirmation on the 5 min chart but market retested the 1.28 level and held 1.28 so far. As long as the Euro holds this level we might see a continuation pattern triggered for a true or false breakout with the start of the new daily candle (Bullish daily candle close at daily resistance-Breakout trading). The next resistance level might be the low of October 11th at 1.2826.

The 4 hour chart shows the two rejection candles on the 13th of November which contributed to the daily rejection candle.

[The hourly chart shows the news shakeout/ stop running on the 14th of November. Market cleared the stops above resistance at 1.2755 (low of Sept. 10th) and then EUR/USD reversed and the logical next target was the recent low to clear the stops of the breakout trader at 1.2724. Stop running is an important driving force in Trading.]

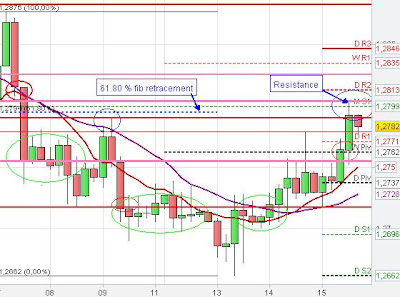
On the hourly and 5 min chart we see that the EUR/USD found support at the low of Sept. 10th and the Euro continued its upward move at 1 p.m. due to the increasing hourly 20 SMA and 200 SMA on the 5 min chart.


On most of the charts we see:

How prices respected support and resistance (blue ellipses), purely stop running behaviour (red arrows), breakout trading setups (red ellipses), continuation chart patterns (most of green ellipses) and support and resistance due to consolidation price zones (orange arrows).


Daily Support and Resistance EURUSD

Technical Chart Analysis Euro US Dollar
4-hour Rejection Candles Hammer 


Technical Chart Analysis Euro US Dollar
1 hour Hammer/ Pin bar Euro US Dollar Candlestick Chart Patterns

Technical Chart Analysis EurUsd
5 min Technical Chart Analysis Euro US Dollar

Daily EURO Support/ Resistance levels

Support and Resistance


EUR USD Technical Chart Analysis


The EURO started to move upward today, after yesterday's news shakeout at 7 p.m. GMT, which cleared the stops above the low of Sept. 10th at 1.2755 and then reversed to clear the stops below 1.2724. 


Today's upward momentum might be the following of the daily hammer candlestick pattern on Tuesday.


The Euro moved higher with the triggering of continuation patterns (green circles/ellipses) and Breakout timing setups (red circles/ellipses) until market reached strong resistance at the 1.28 level. This resistance zone consists of the low of October 1st, the monthly S1, the 61.80 % Fibonacci retracement on the 4 hour chart and the 38,20 % Fibonacci retracement on the daily chart. Market reversed at the 1.28 level and started to move lower.

On the 5 min chart we see how market broke through the downward sloping green trend line at 2:15 p.m. (Breakout trading-prior candle closed at trend line) so that the consolidation/ triangle got terminated.  Market started to consolidate in a  shape of a continuation pattern after the breakout of the triangle and price retested the daily R1, the high and the downward sloping trend line of the consolidation (resistance becomes support-successful retest). The Euro terminated the continuation pattern on the 5 min chart and market broke through yesterday's high with the beginning of the new hourly candle after the previous one closed strongly at resistance (yesterday's high-Breakout trading).

Recent main support and resistance levels have been the low of October 1st and September 10th and the high of last Tuesday. Yesterday's high (news spike) is also likely to play an important S/R role.


Daily Support and Resistance EURUSD
Daily Support and Resistance EURO Fibonacci retracement


Technical Chart Analysis Eurusd
4 hour Daily EURO Fibonacci retracement, Resistance Levels


News Shakeout technical chart analysis eurusd
hourly EURO Support/ Resistance


Technical Chart Analysis Euro US Dollar
5 min Support and Resistance


The Chart Analysis of the trading days before


On the daily chart (first chart) we see that the EUR/USD created a hammer candlestick pattern yesterday. Market moved higher and the Euro is currently trading at the low of September 10th at 1.2755 (pink line) and the daily 10 SMA. Slightly above is the hourly 200 SMA, the weekly Pivot point and the daily R2.

Yesterday's high at 1.2729 (thick blue line below) initially acted as resistance but after the level got broken the blue line acted as support and market bounced back from yesterday's high (successful retest, changing role of daily S/R levels). The rising 20 SMA on the hourly chart also provided support at 7 a.m. together with the consolidation price zone (green ellipse, orange arrow) and again at 4 p.m..


 Technical Chart Analysis Daily S/R
1 hour  Hammer Chart Pattern | Daily S/R | SMA

Back to top