Trading the Breakout
Unconfirmed Breakout candle
In the Asian Forex trading session
the Euro traded up to 1.2525 but then market started to move down sharply due to the market news about Spanish bond yields (see 5 min chart). |
| Daily Double Top pattern |
 |
| 5 min Market News Trading |
 |
| hourly Timing Setup |
From the chart technical perspective the Euro formed a bear flag at about 8 a.m. GMT on the 5 min chart before resuming its down trend.
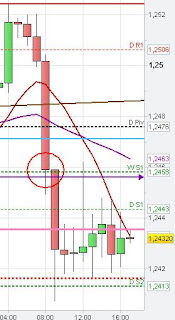
The Euro breached the weekly S1 and the monthly low of March 2009 initially after the 8 a.m. hourly candle closed at this level (red circle) and the new hourly candle started (Breakout Timing for Trading; 9 a.m. market news).
The strong bearish 5 min "news" breakout candle at 9 a.m. triggered the market order stops below the recent lows, particularly the low of the 8th of June at 1.2435 (pink line) and the stops below the March 2009 support level at 1.2456, which held the market this week.
However, the breakout candle at 9 a.m did not get confirmed on the 5 min chart (no close of the succeeding candles below the range of the breakout candle).
The Euro found support at the daily S2 and the 61.80 % Fibonacci Extension (A-B at C) on the daily chart (stop clearing below the recent lows accomplished- first test).
The 5 min candle at 9:15 a.m.breached the daily S2 but closed above it and also in the range of the prior breakout candle and the Euro started to consolidate around the 1.2435 level (pink line-June 8th).
On the 5 min chart we see that the Euro found resistance at the pink line before breaching it to the upside.
The Euro closed above the daily S1 at 12.15 but found resistance at the weekly S1 so that market fell back into the consolidation around the pink line.

