Risk Disclaimer

Risk Disclaimer: Trading is risky! Never trade money you can not afford to lose! Site content is only personal opinion and never a Trade Recommendation!

Clearing of stop and limit orders

Forex Stop Running


Stop and limit order clearing through false breakouts


Today, in the Asian session the Euro triggered/ cleared the stop and limit orders above the high of last week and then started to retrace back at the daily 61.80 % fib retracement and the weekly 10 SMA.


The solely clearing of stop and limit orders at striking price points like market lows and highs is a typical manipulative market behavior and price target of the Forex Manipulators particularly at the first test of these levels with all the stop and limit orders there - false breakouts/ non confirmation.

Daily Chart analysis Euro
Daily 61.80 % Fibonacci Retracement


On the 5 min chart (below) we had two pin bars which closed in the price range of the preceding 5 min candle (price rejection/ non-confirmation). Both pin bars led to a reversal, whereby the first pin bar cleared the stops below the recent low which often increases the chance of a price reversal - stop clearing accomplished.

We also had a kind of Head and Shoulders pattern on the 5 min chart. The market reached the Head and Shoulders target (neckline is the brown line).
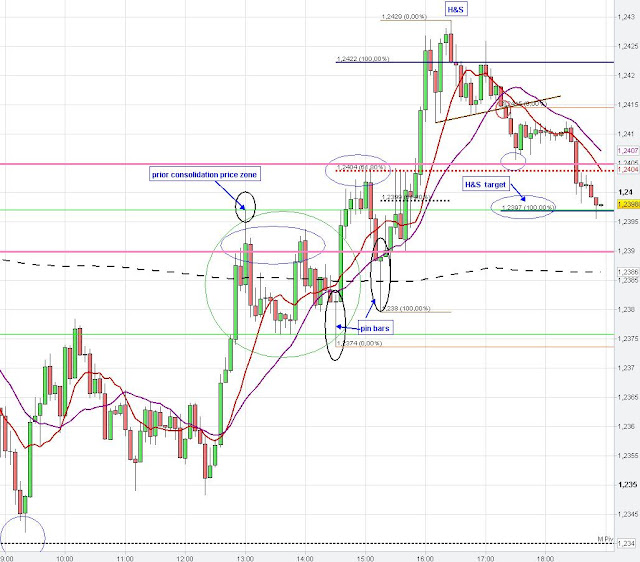

pin bar, Head and Shoulder pattern
5 min pin bar, Head and Shoulder

Stop Runs during News release

News releases in Forex


Stop Running


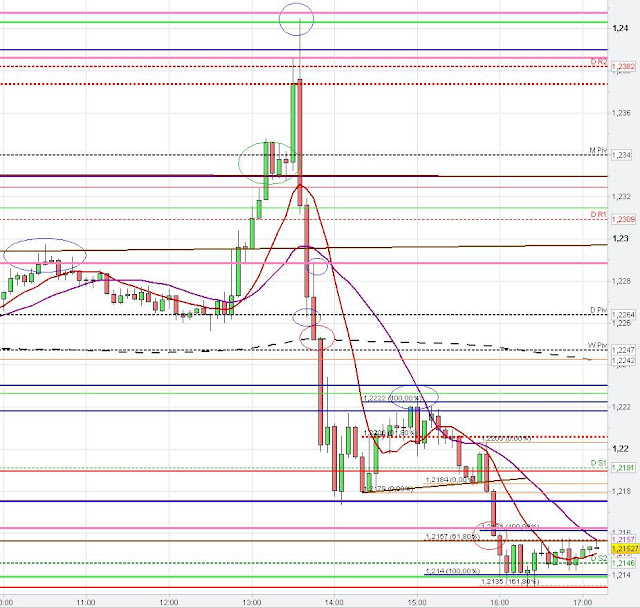
Stop run (shakeout) to the upside after daily bull flag got triggered and market took out the recent daily high. The Euro found resistance at the low of June 28 at 1.2407 and the weekly 10 SMA at 1.2409. After taking out the stops above the high of July 27 at 1.2390 the Euro reversed strongly (Stop clearing accomplished...). The Euro currently found some support at the daily S2, the 38.20 % fib extension from the recent hourly swing down (not shown) and the price zone of the consolidation from the 26th of July.

Yesterday, we had a potential H&S (tricky pattern) on the hourly time frame.

Particularly on the 1 min chart we see how the Fibonacci study could help to anticipate support and resistance.

head and shoulder, news trade, shakeout
1-hour Euro US Dollar Chart Analysis


shakeout,momentum trade, chart analysis
5 min Eur/Usd Dollar Chart Analysis
momentum trade, chart analysis
1 min Euro Dollar Chart Analysis

Back to top