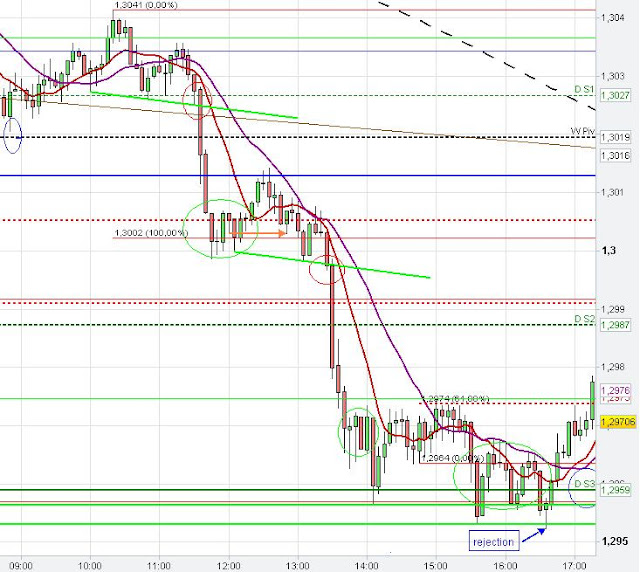
1.30 price zone in EURUSD
Trading Important Chart levels
The Euro
found resistance at the Head and Shoulders neckline yesterday and formed a Three Drives pattern (see 1 hour chart). From this top, the EUR/USD moved down whereby the downside momentum increased today.The hourly 200 SMA, the daily S1 and the weekly Pivot point provided temporary support for the Euro before the market moved lower to the psychological important 1.30 level.
Many stops can be anticipated below this major psychological level so that at least a temporary breach of this support level could happen to clear some stops. The 61.80 % fib extension at 1.3005 on the 4 hour EUR/USD chart got respected by the 4 hour candle starting at 8 a.m. GMT before the new 4 hour candle breached this important psychological 1.30 level (Timing setup).
The strong 5 min momentum candle at 1.30 p.m. shows the momentum created by the stop triggering and the follow through. The EUR/USD went lower to the next major support level at around 1.2957 created by the 100 % fib extension and the 200 SMA on the 4 hour chart and the daily S3, which supported the Euro US Dollar so far.
On the daily Euro chart we have a potential bearish "222" Gartley pattern.
 |
| 4 hour Fibonacci extensions |
 |
| Daily Gartley pattern |
 |
| 1 hour Head and Shoulders pattern |
 |
| 5 min Neckline break, Momentum |
I like your analyses. In this moment, I'm studying SMA to use correctly on different time frames charts. So, one remark in your case : on 4H Chart - 200 SMA is not the correct one. In my opinion, it was only pure luck, that your 200 SMA on 4H chart offered support, because 20 SMA on daily chart = 120 SMA on 4H chart which is very closed to 200 SMA used by you on 4H Chart. So, in fact the support was given by the 20 SMA and not by the 200 SMA on 4H chart.
ReplyDelete200 SMA is around 1.28330 and used it like this only a daily frame..if you want to see 200 SMA on a 4H chart, setup 1200 SMA. Like, this you will have the correct 200 SMA on 4H chart.
Thanks for your comment. I do well my the 200 SMA. I do not know whether your remark is related to the 200 SMA on all time frames or only to the 4 h chart. I assume the second. I did not have so many trade setup ups with the 200 SMA on the 4 hour chart, however I still think that it also works well on the 4 hour chart. I am not sure about the difference between my and your 200 SMA. I would observe both and see how market reacts on them to see about which one traders care most.
ReplyDeleteMoreover, the support zone at around 1.2959 was also created by the 100 % fib extension from the major 4 hour swing and the daily S3. So it was not soley about the 4 hour 200 SMA but it further strengened the support zone and increased the probability of a market reaction. Furtehrmore, the 20 SMA on the daily was at around 1.2980 and yesterday the daily candle closed at around this level and thus respected the daily 20 SMA. In my opinion the used 10,20,200 SMA are working well and they have prediction value so I do not see a reason to change themand I would be cautious to do so.
Let me know what you think. I am interested in your ideas and remarks!